Kentyou is a company specialising in smart city technologies and digital solutions for territories. It develops solutions that enable cities and organisations to collect, analyse and make better use of urban data. Kentyou helps stakeholders better understand how cities are used, monitor urban activity and make more informed decisions to support the sustainable transformation of territories.
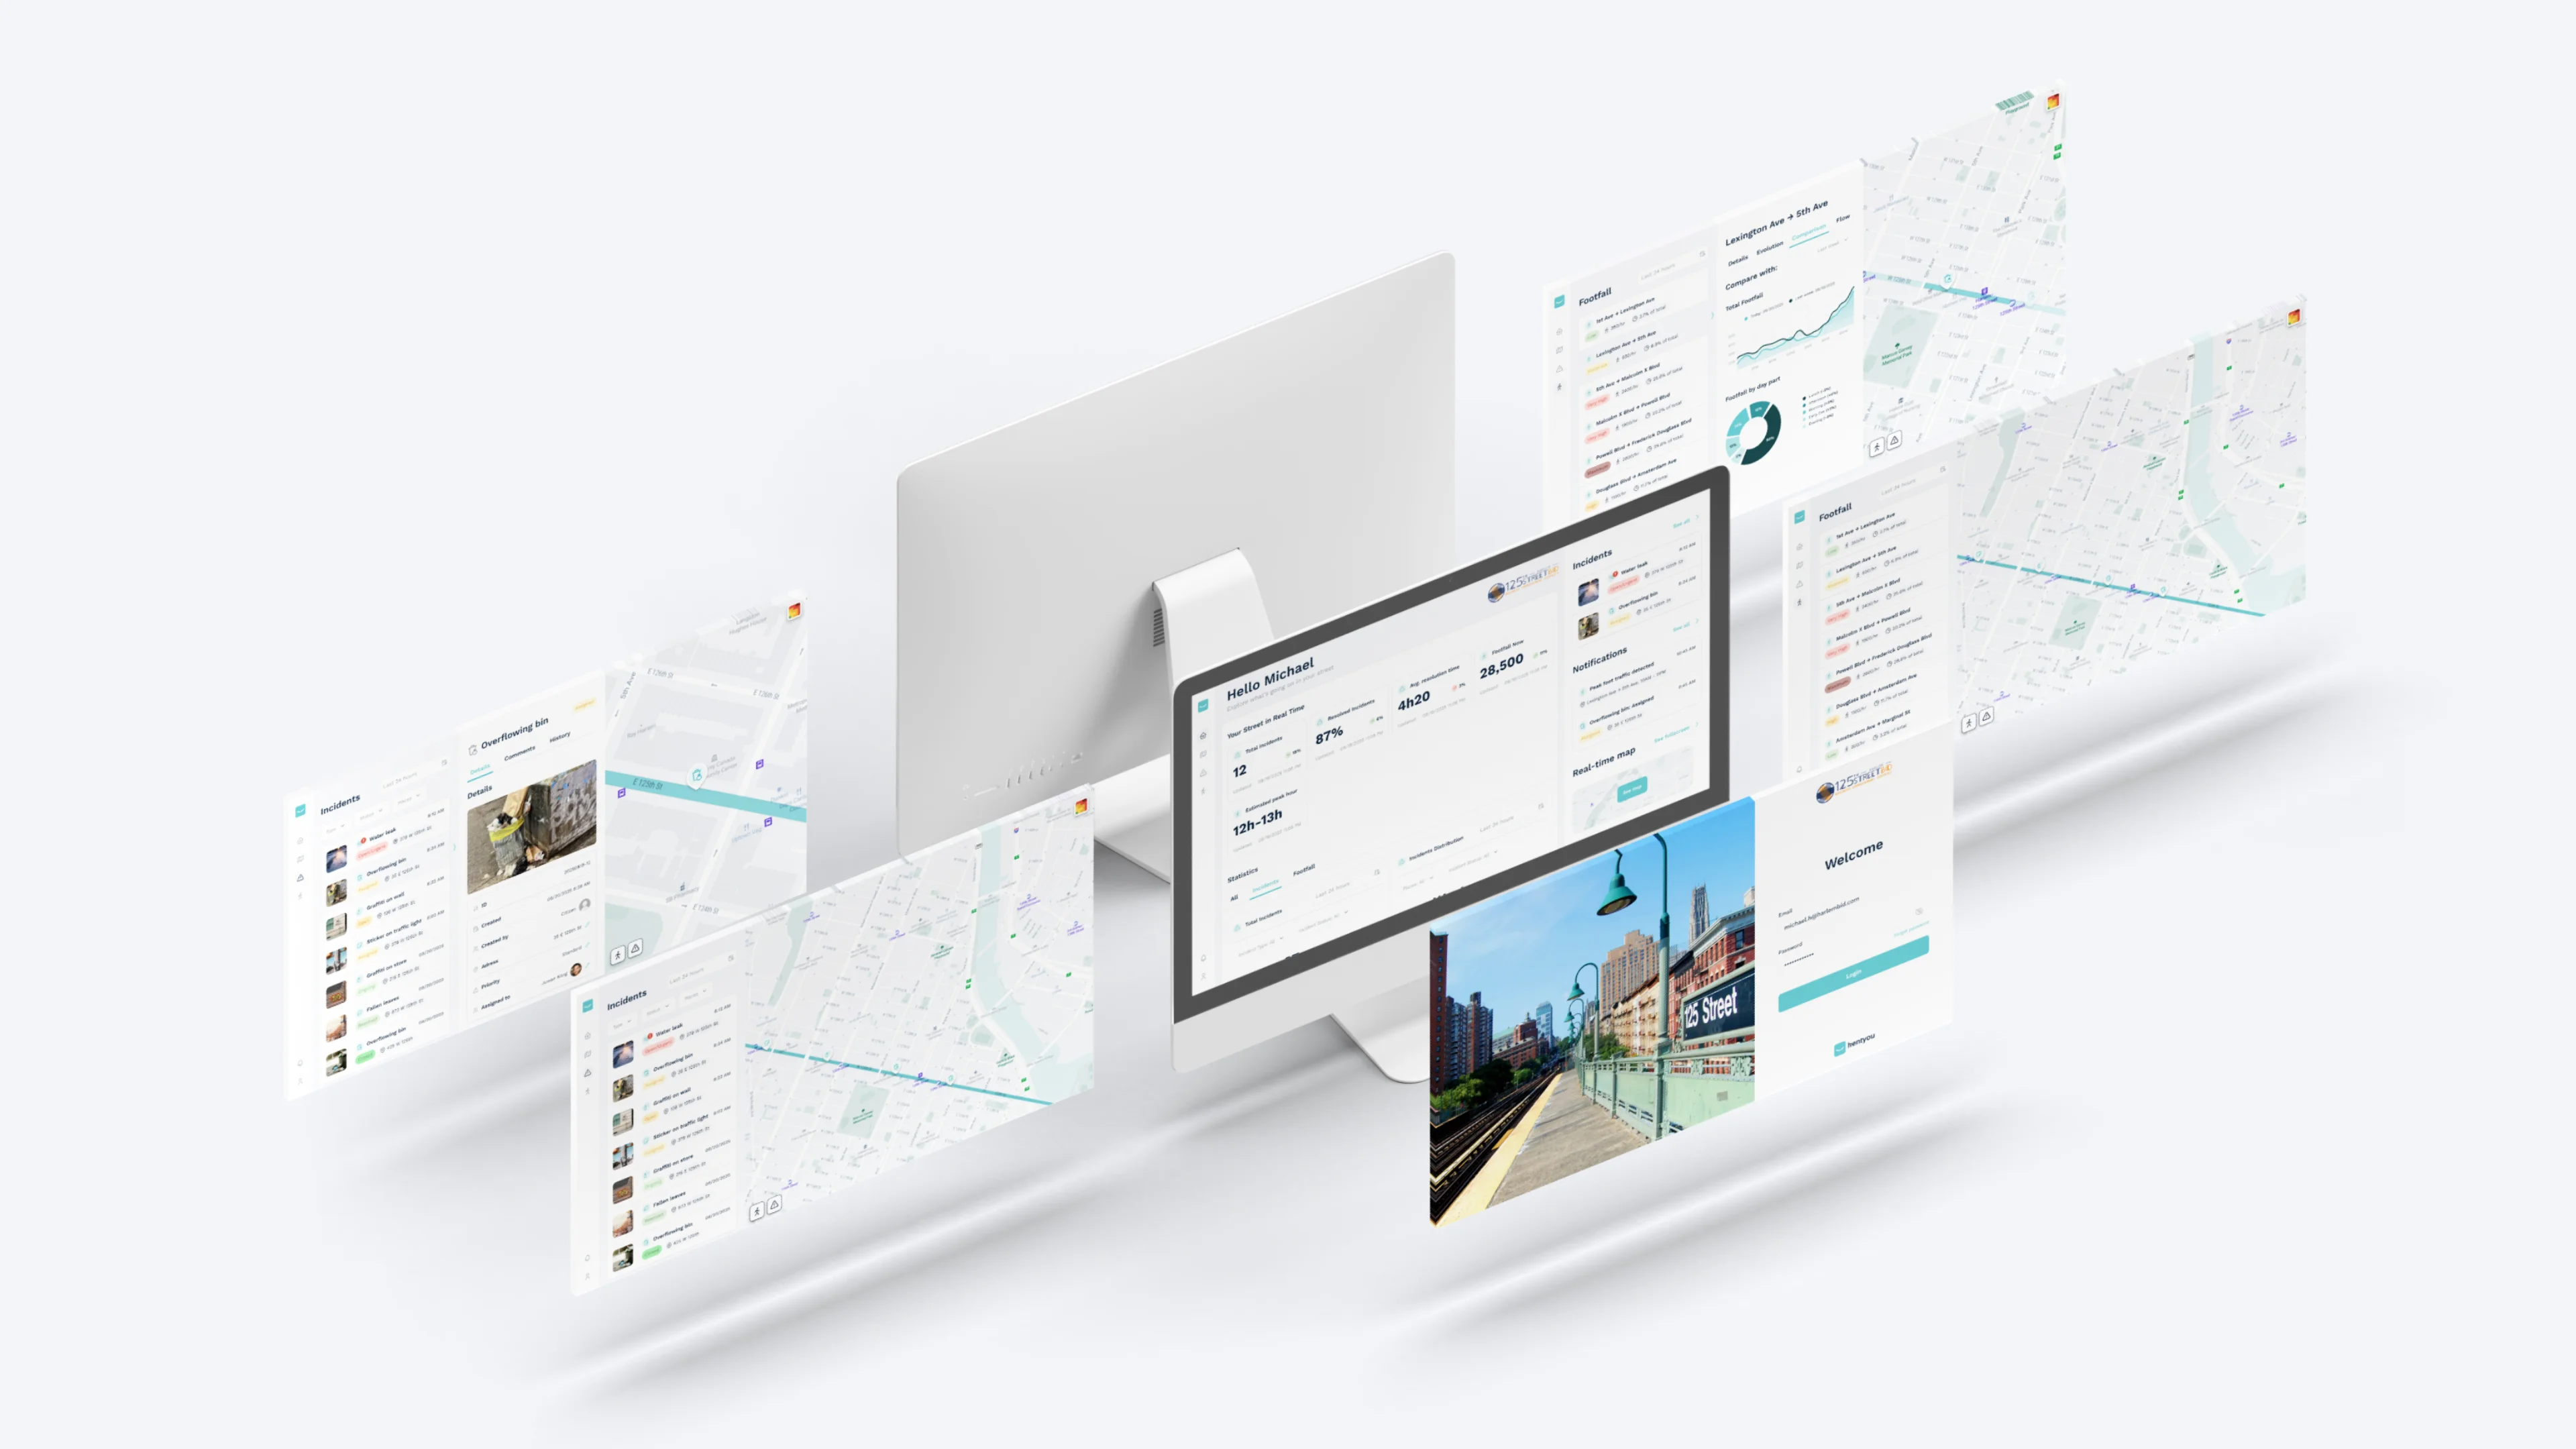
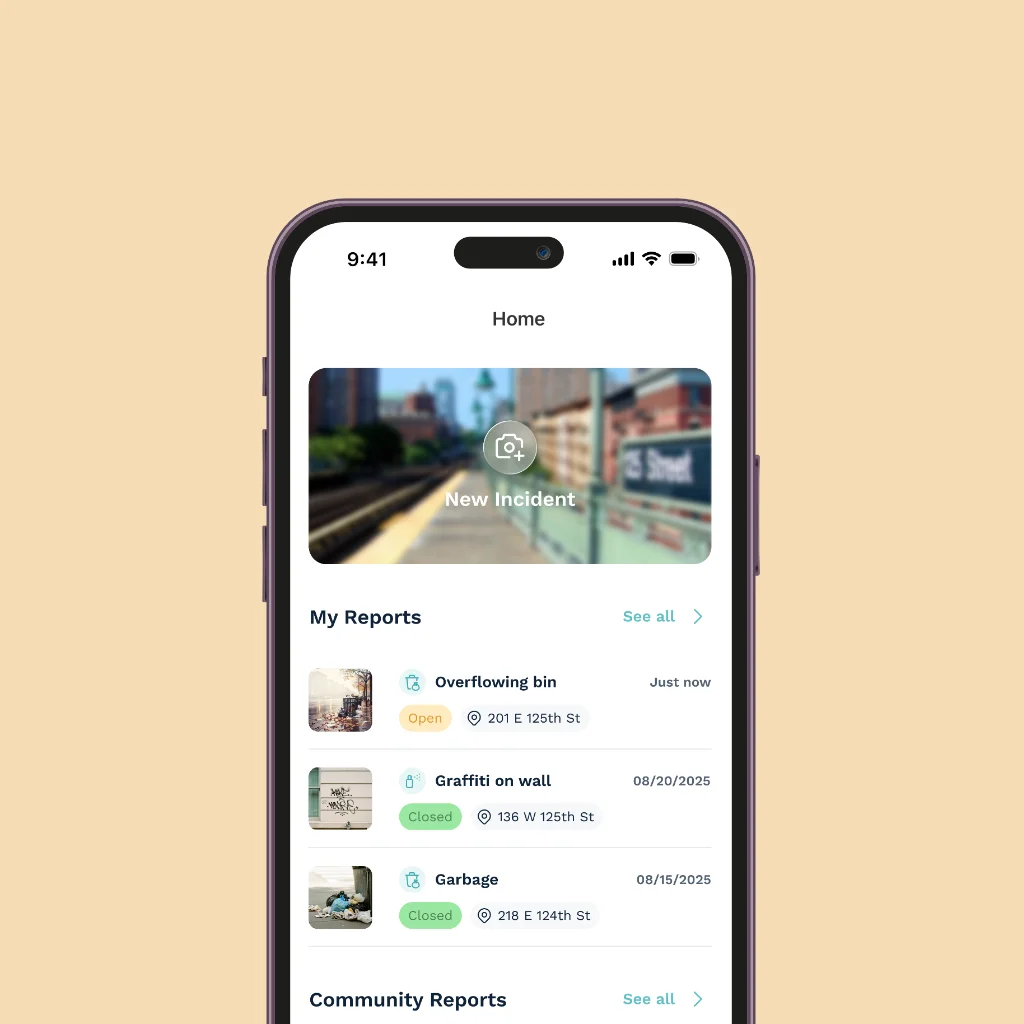
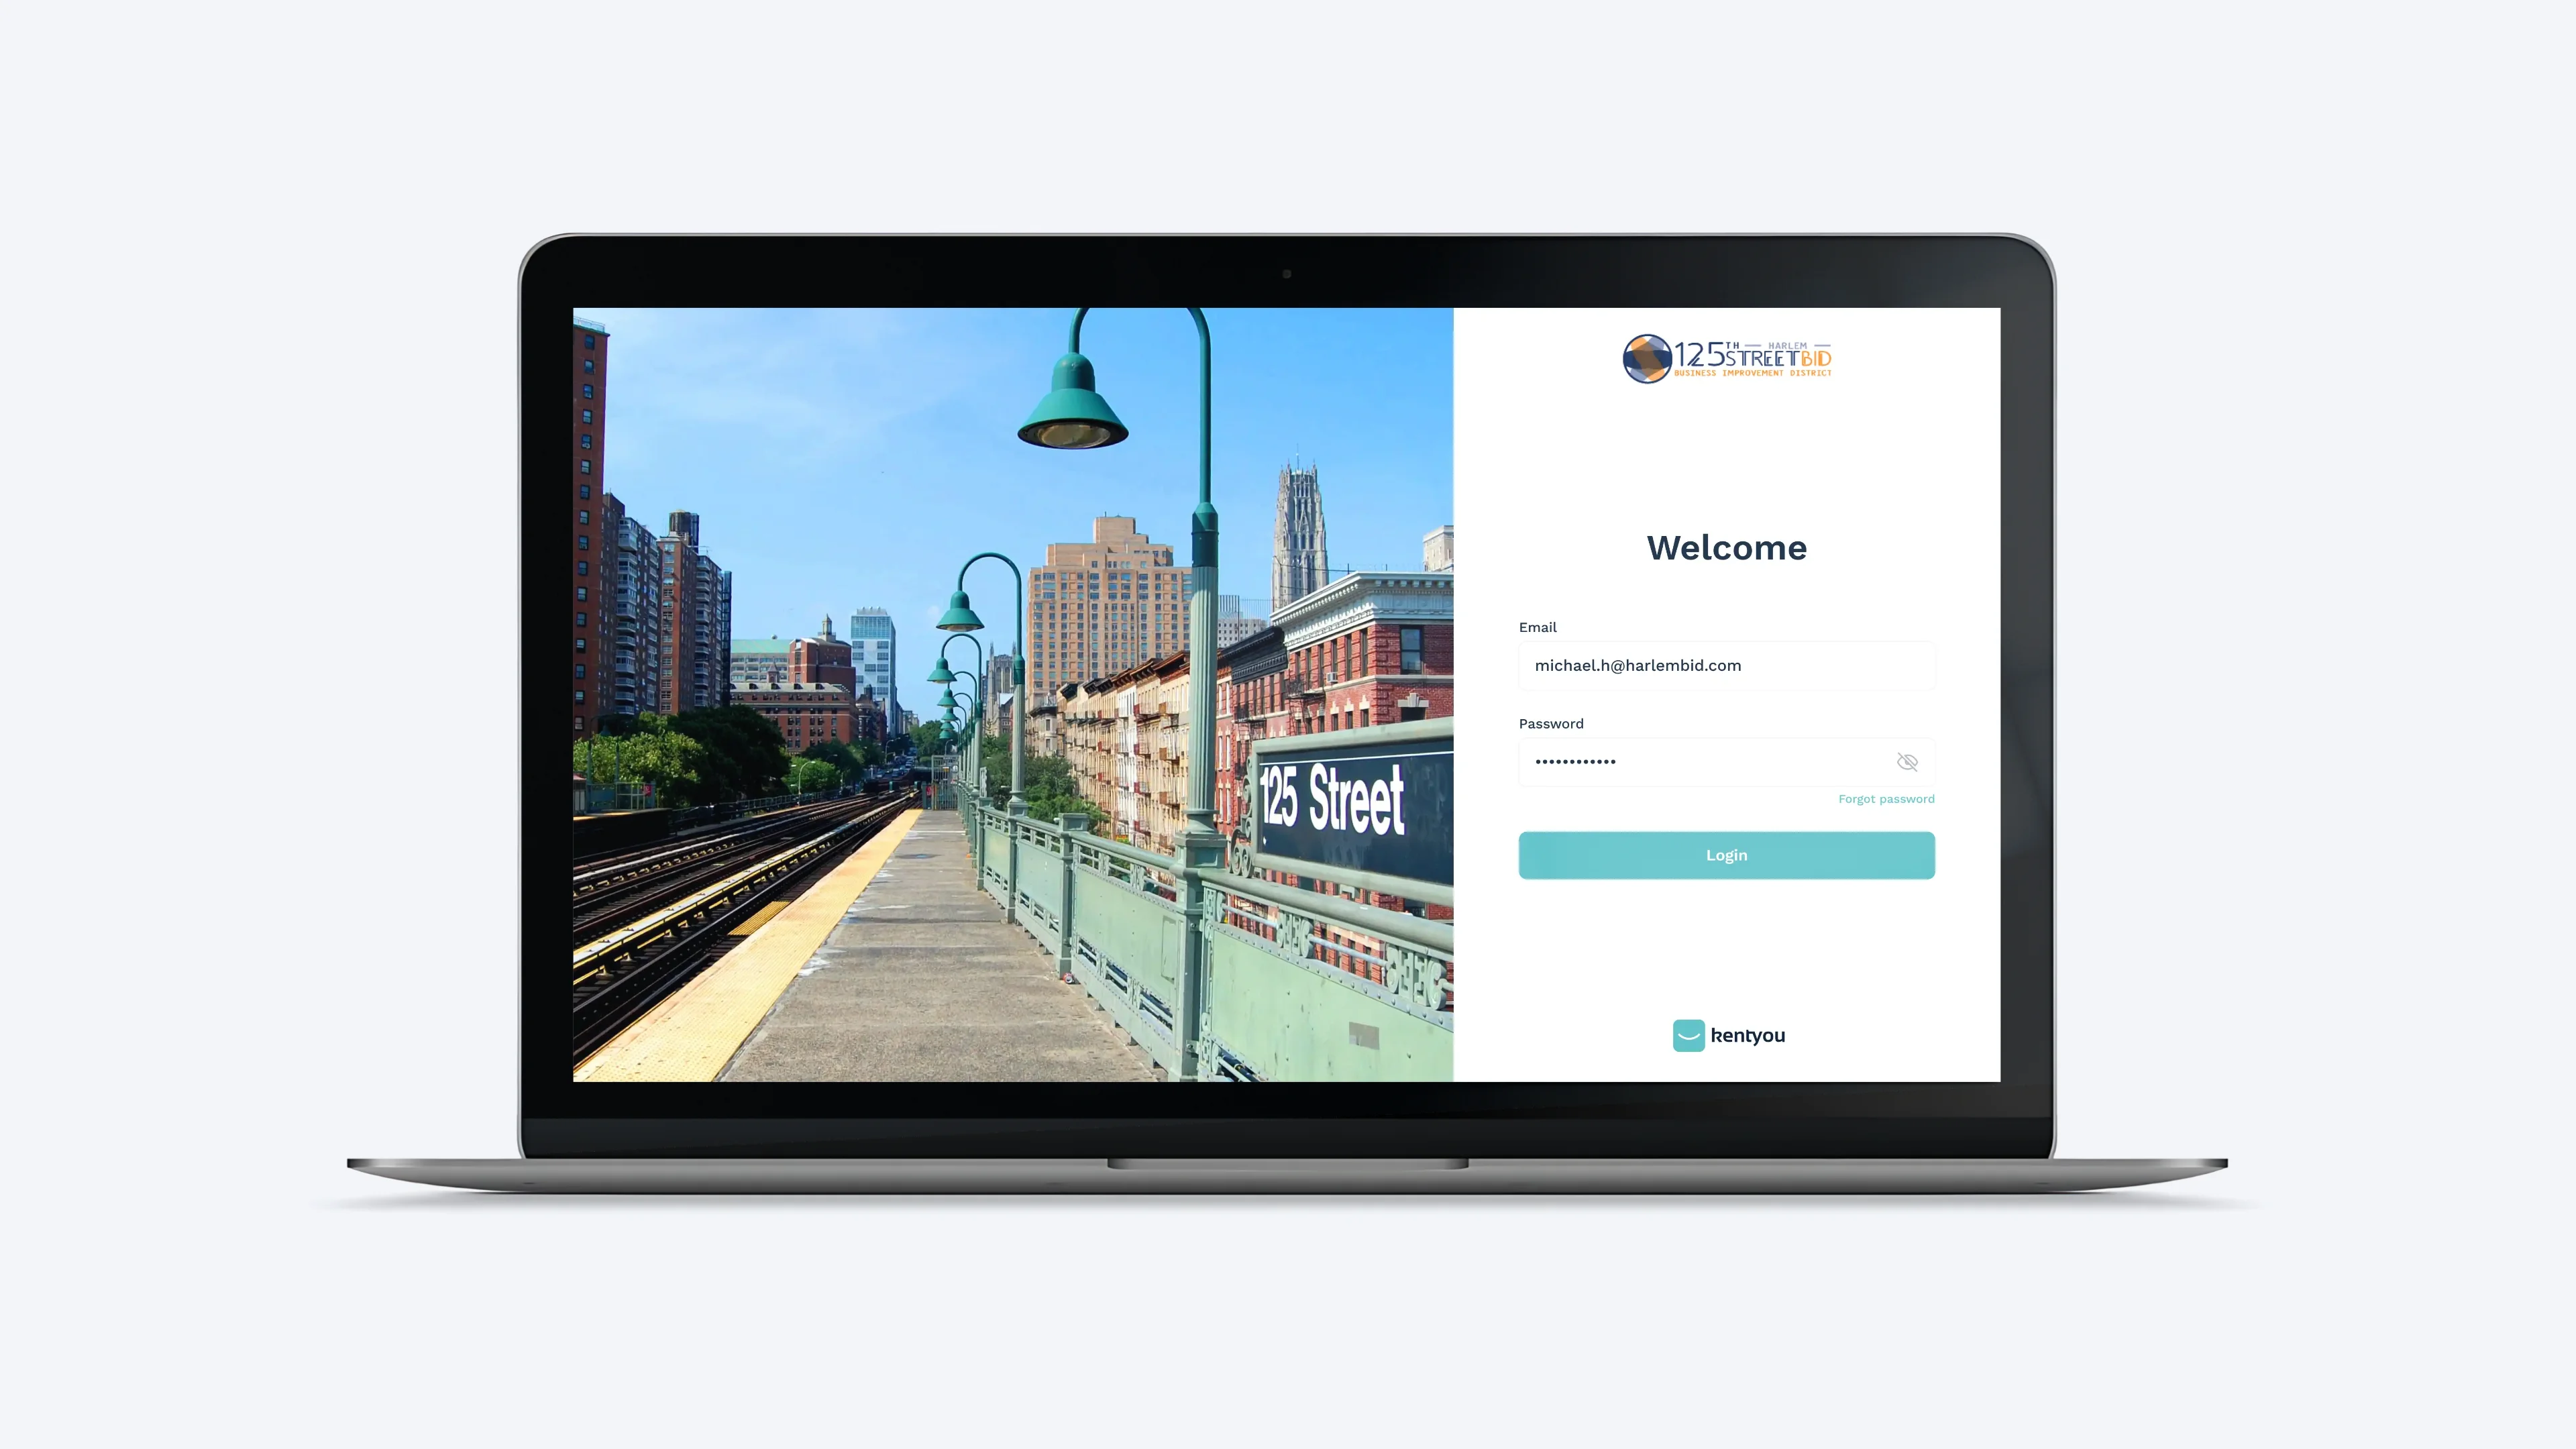
An application designed for Kentyou and the 125th Street Business Improvement District (BID) in New York, aimed at facilitating the reporting, tracking and resolution of incidents across the streets of Harlem through mobile and desktop applications, including a management dashboard.
My role was to design the user experience and interface of the application, structuring the journeys of different user profiles to optimise incident reporting and tracking, both on mobile and through the management dashboard.
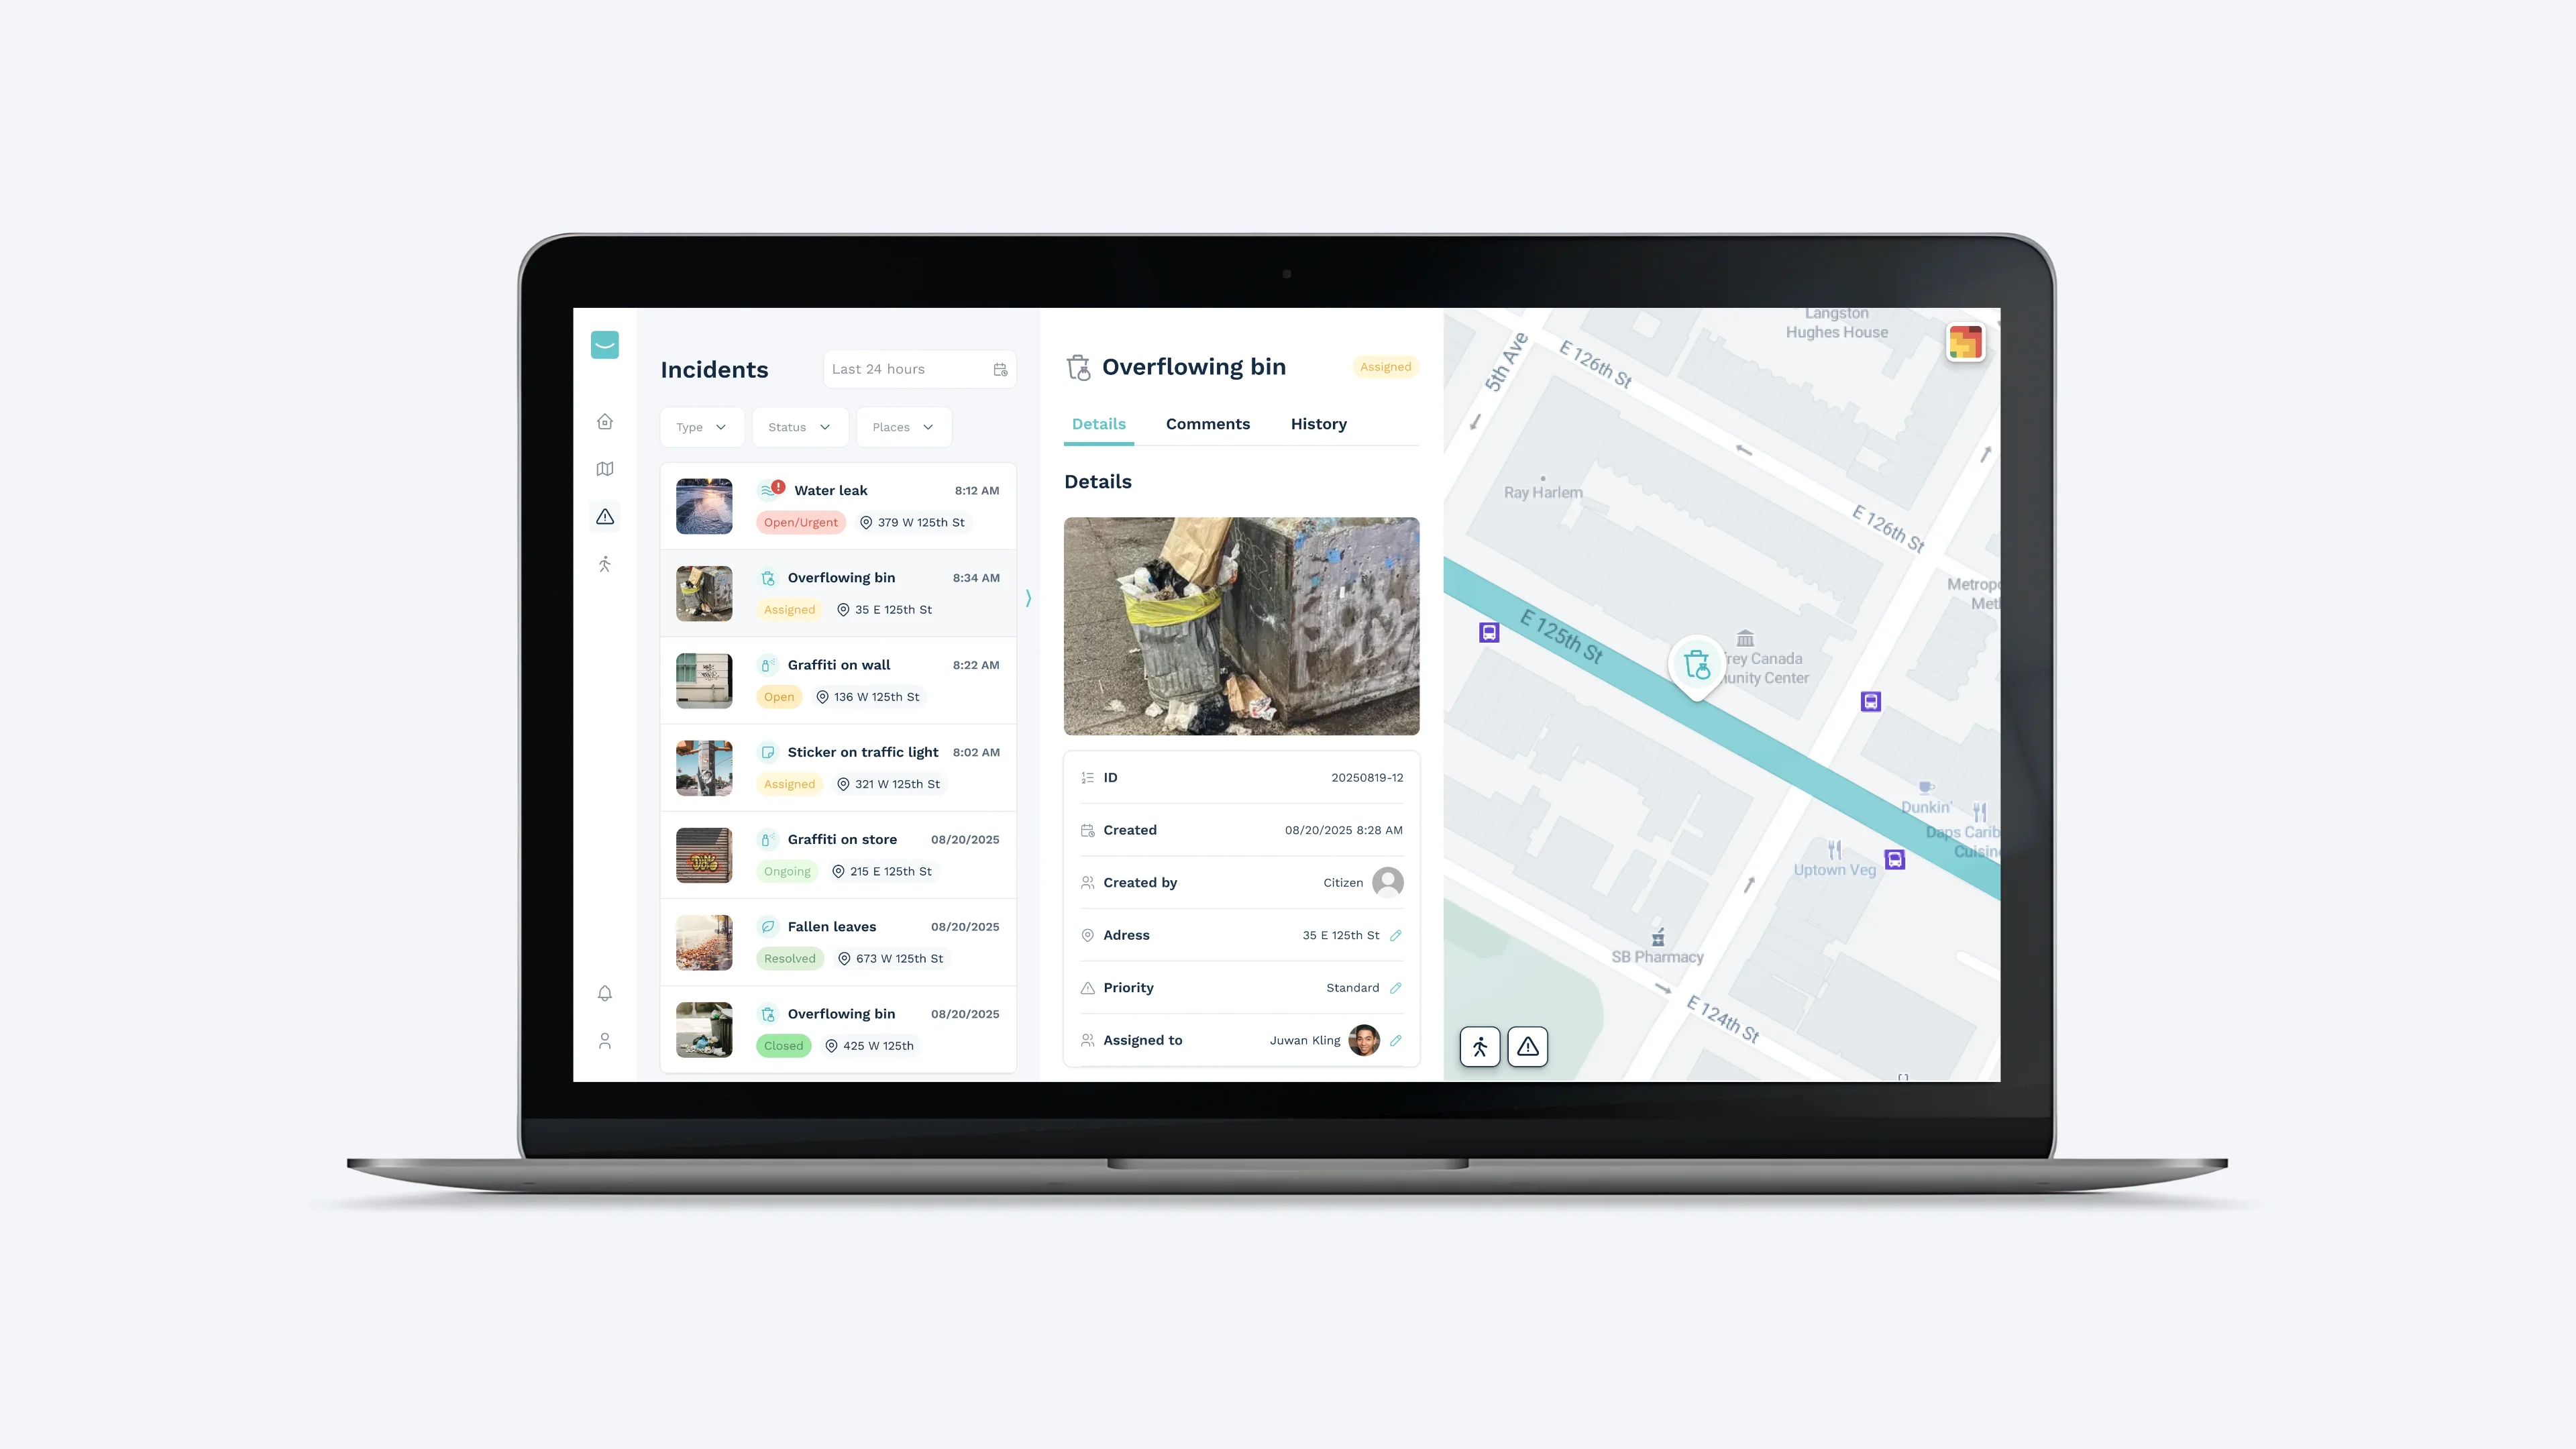
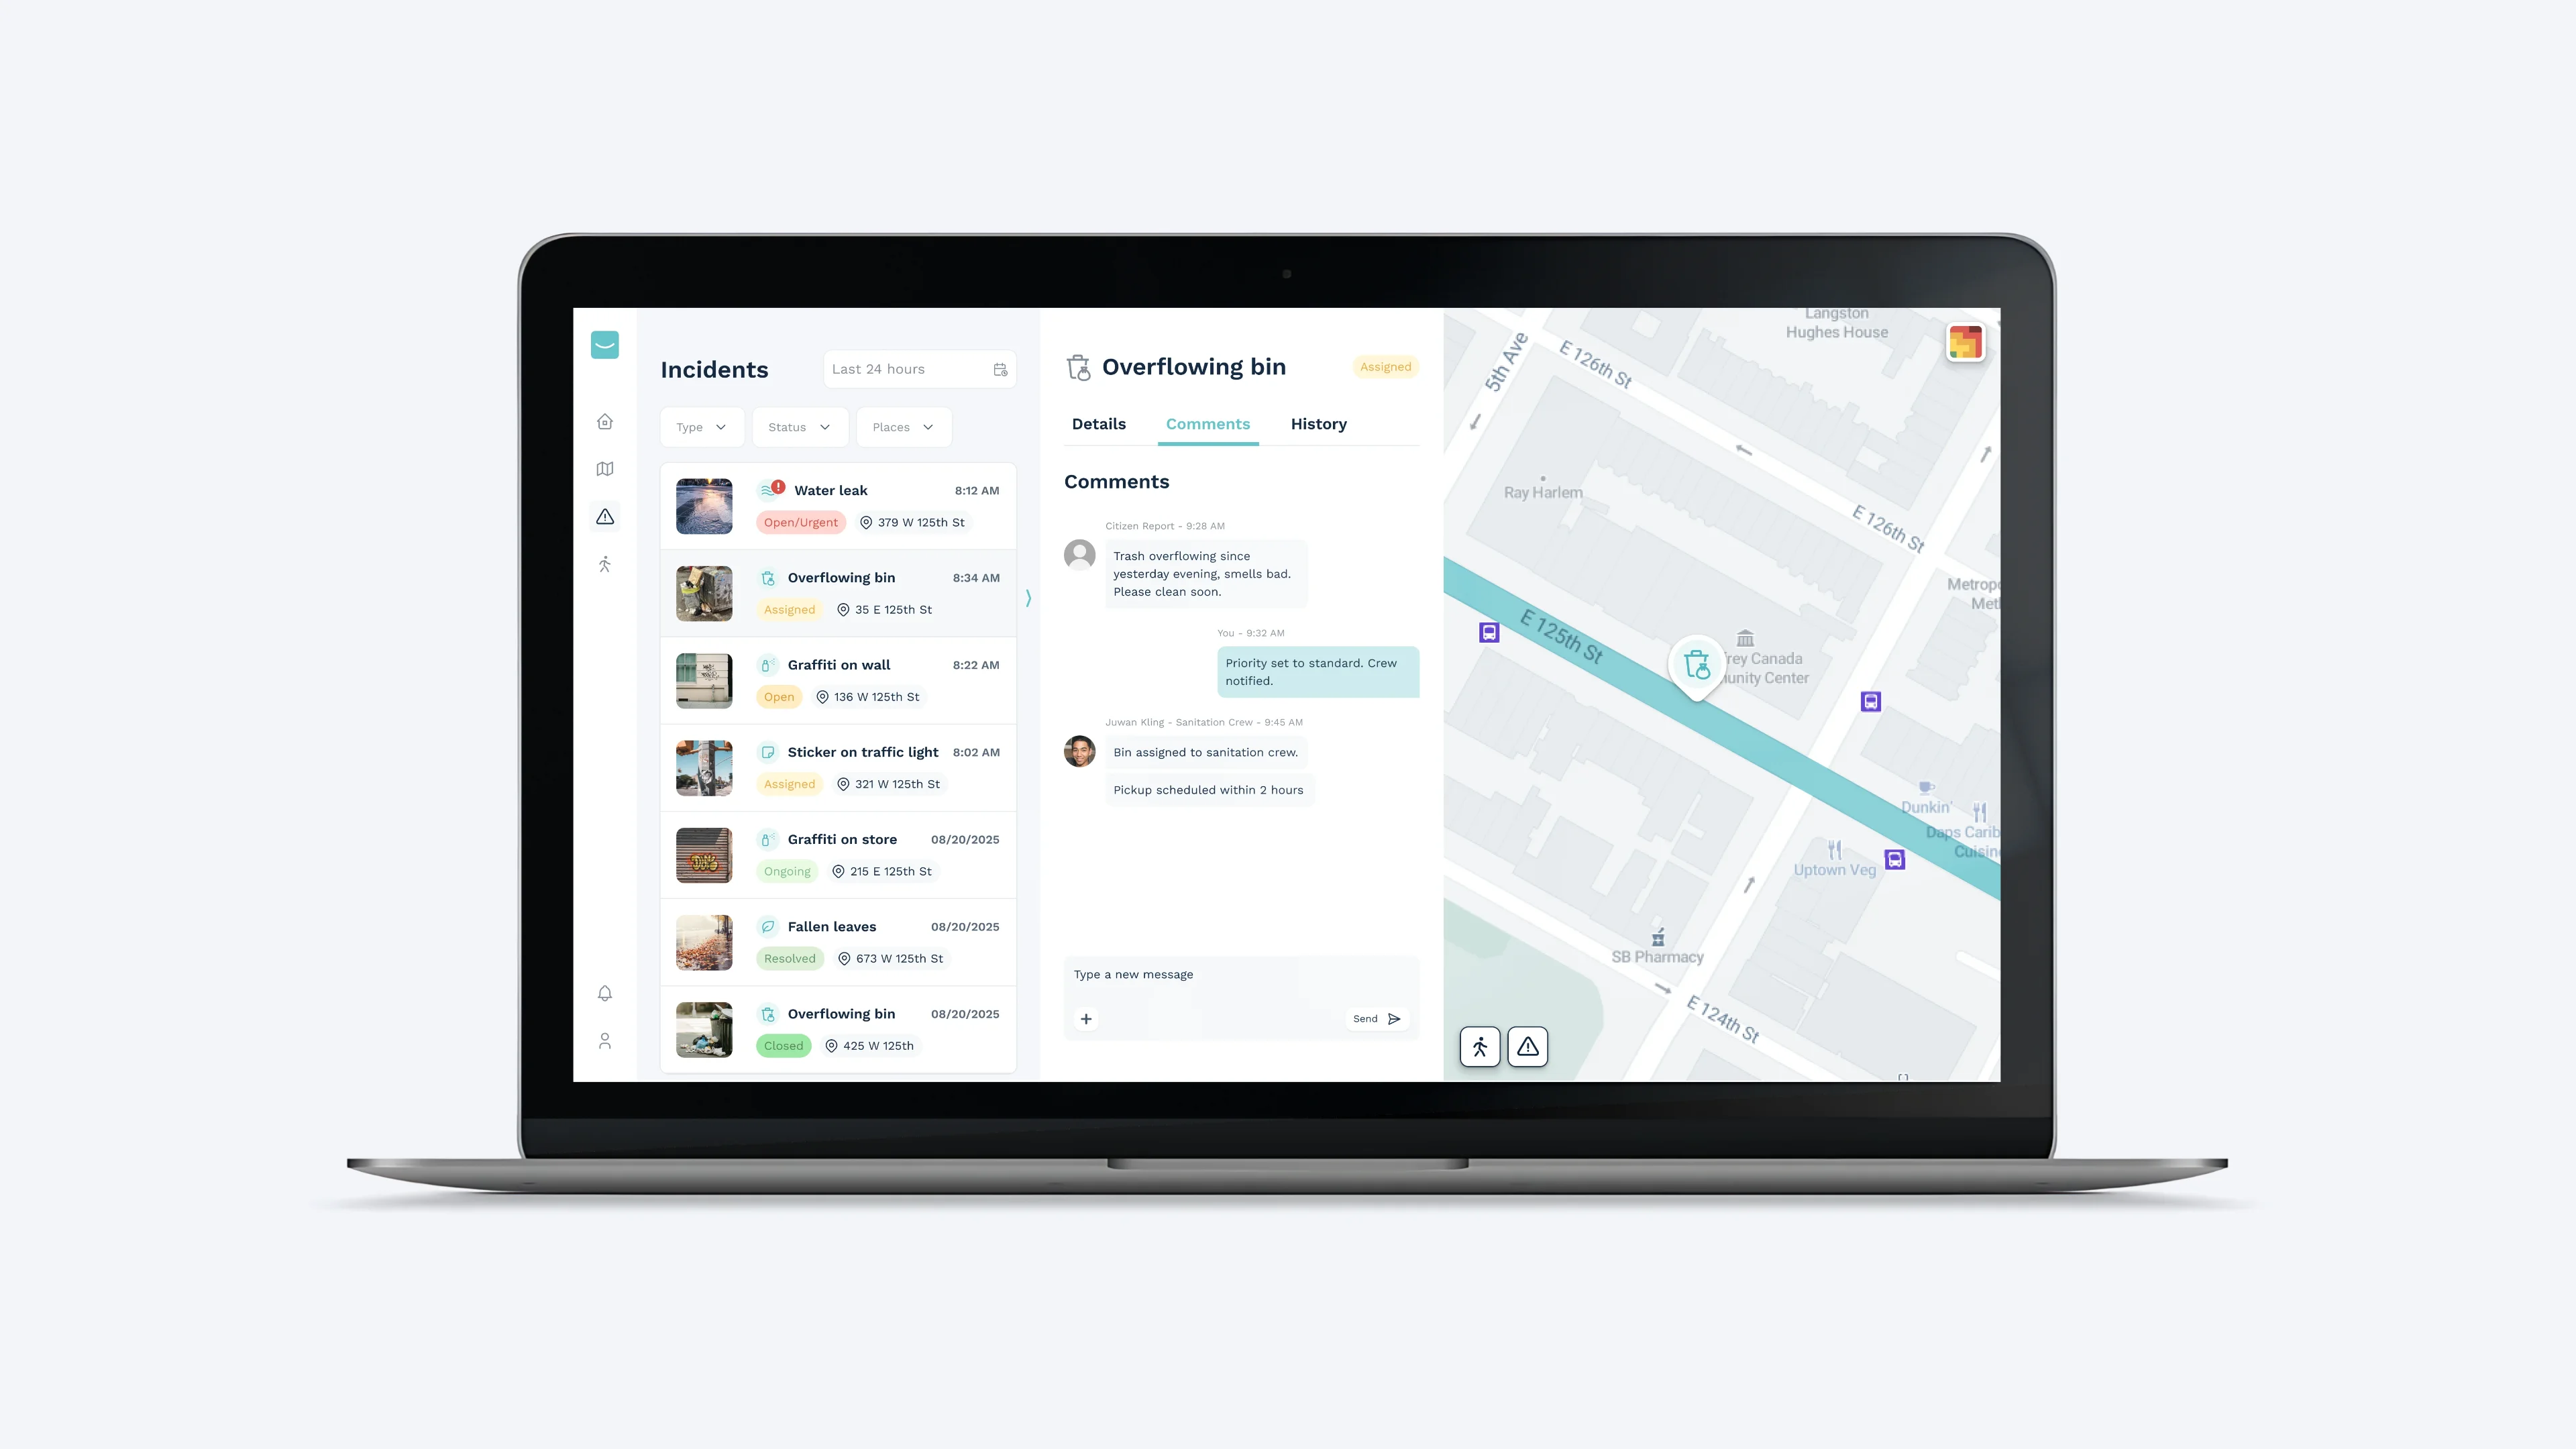
Design of the main user flows to structure the experience around two user profiles: field teams and external contractors. The Incident Management section (Desktop) allows supervisors and contractors to view assigned incidents, access their details and confirm their resolution.
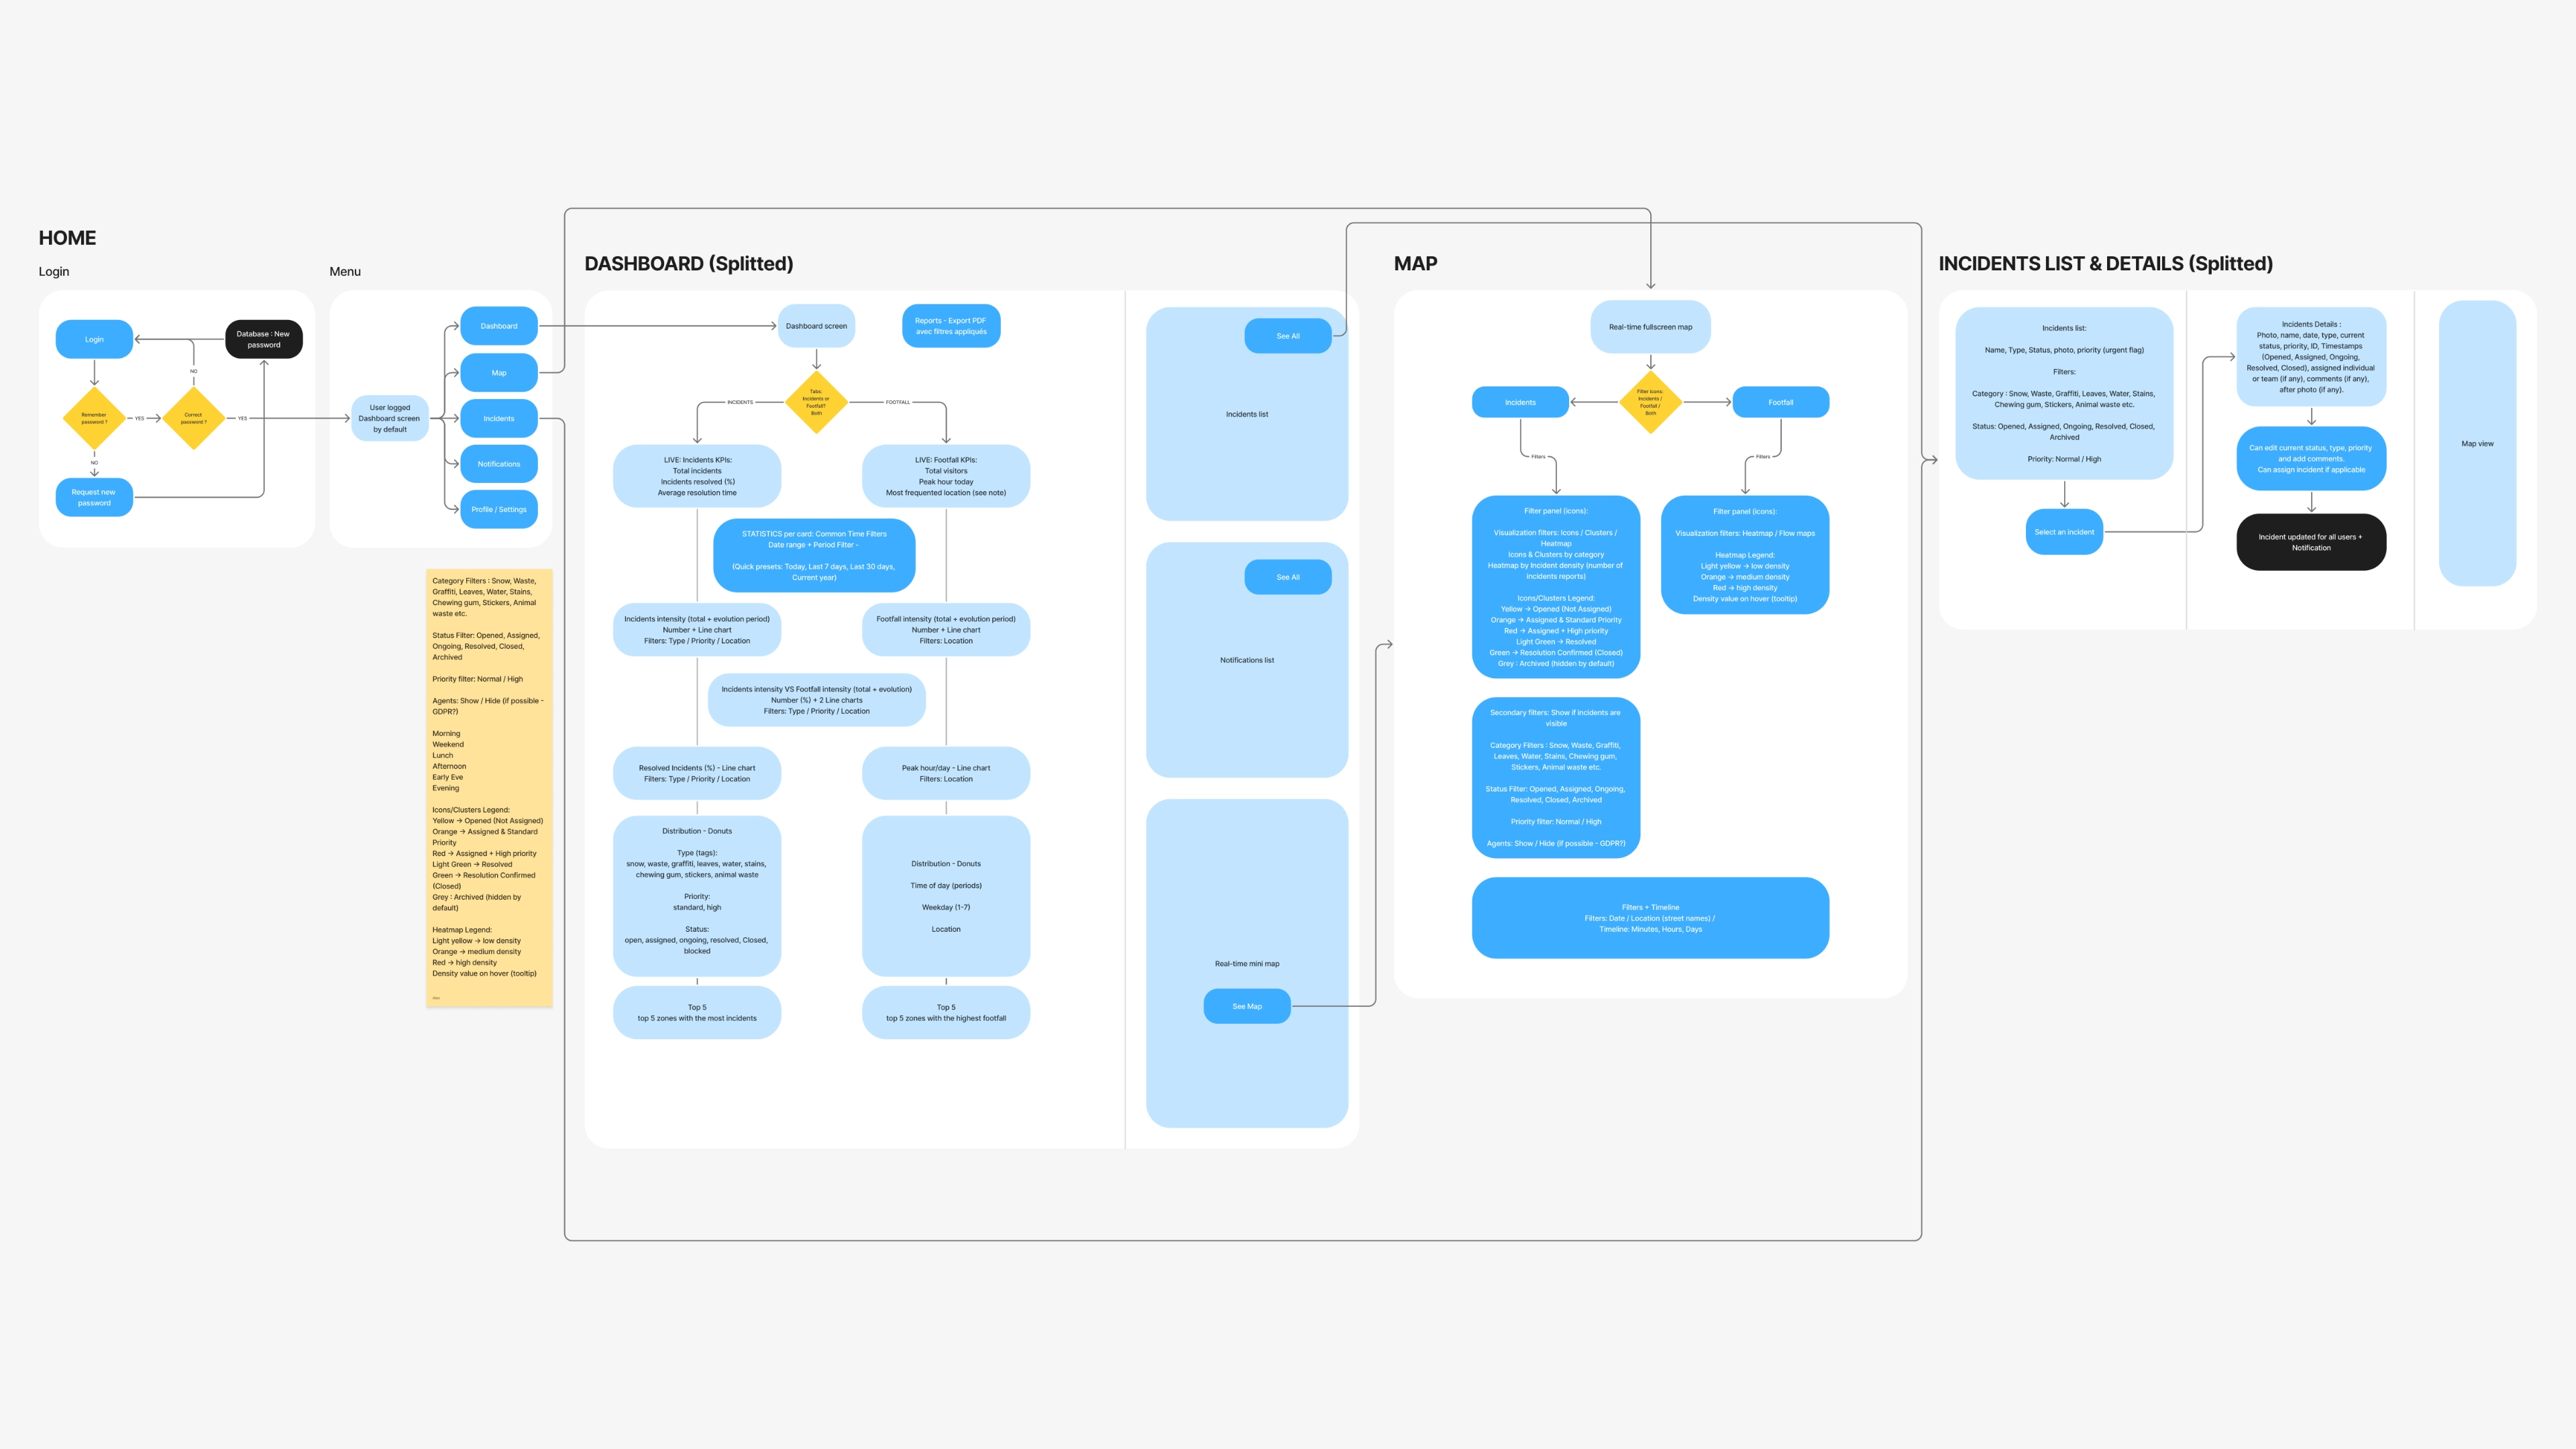
Design of User Journeys to understand the different steps and needs of users within their context of use. For contractors, the journey is primarily focused on incident management: viewing assigned interventions, accessing key information and confirming their resolution.
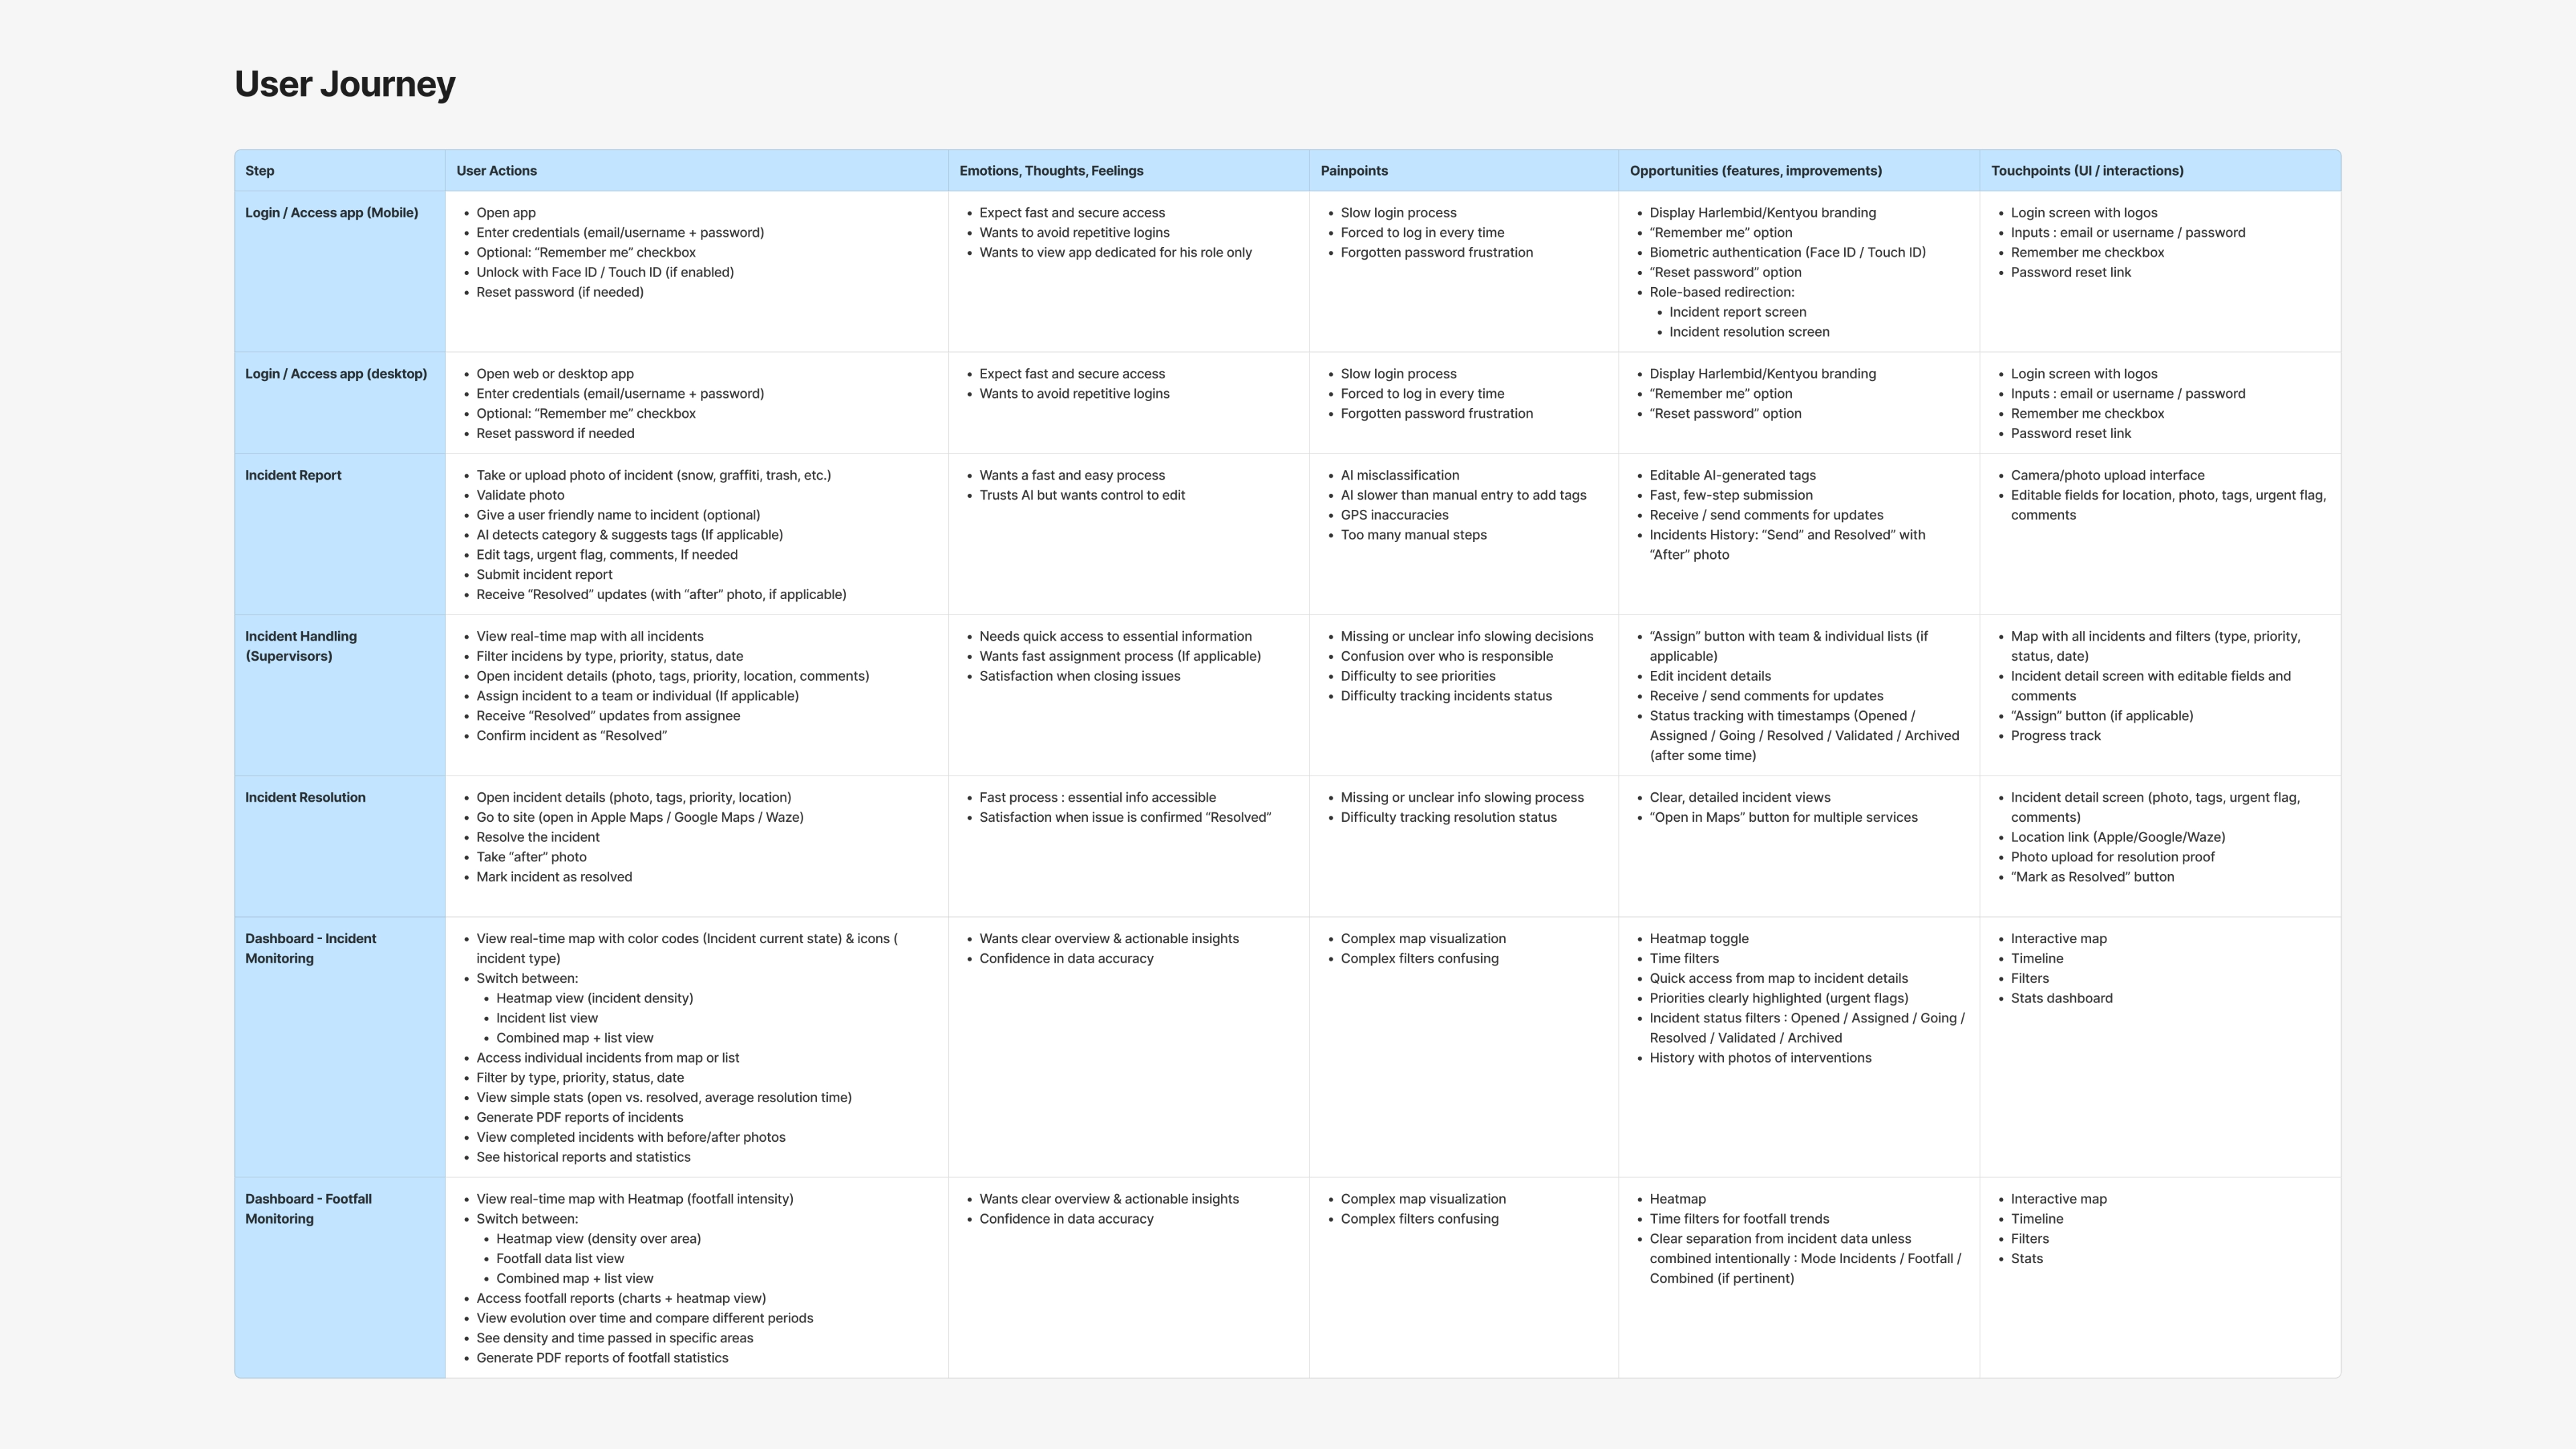
Adaptation of Kentyou’s existing Figma components to the project’s specific requirements, while maintaining consistency across the wider product ecosystem.
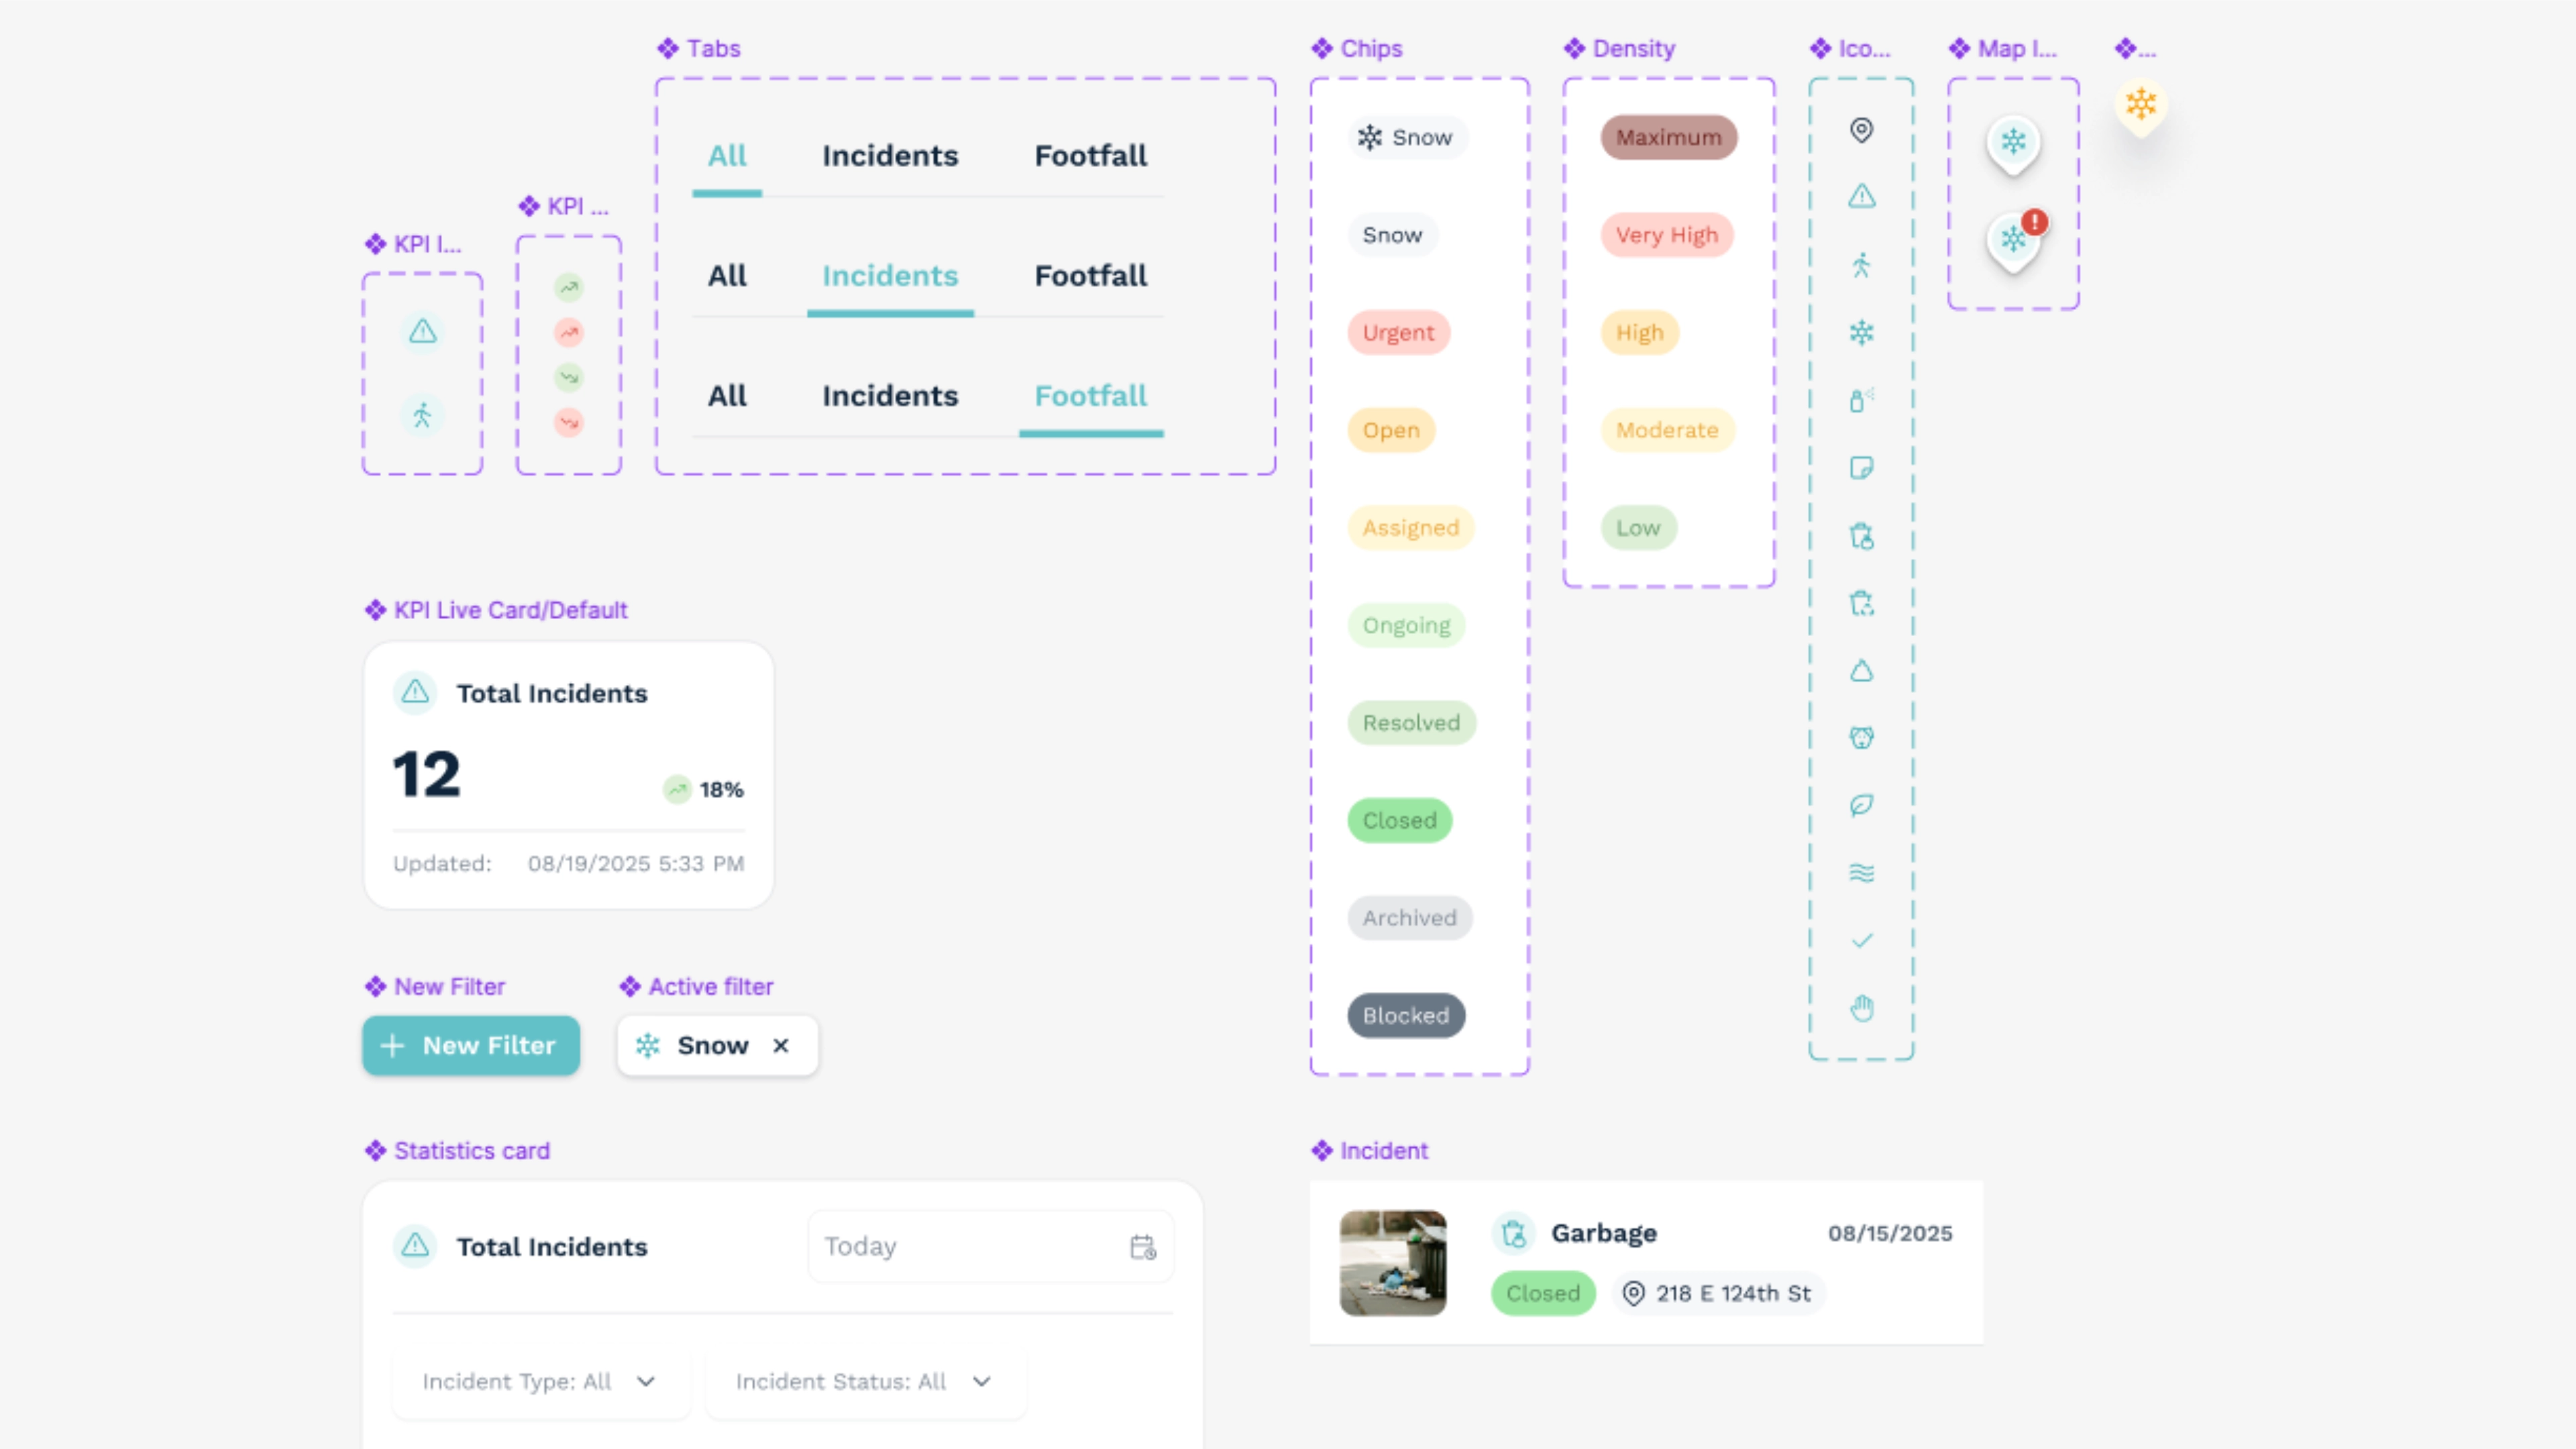
Design of wireframes to structure the main screens and validate the user flows before moving into the UI design phase.
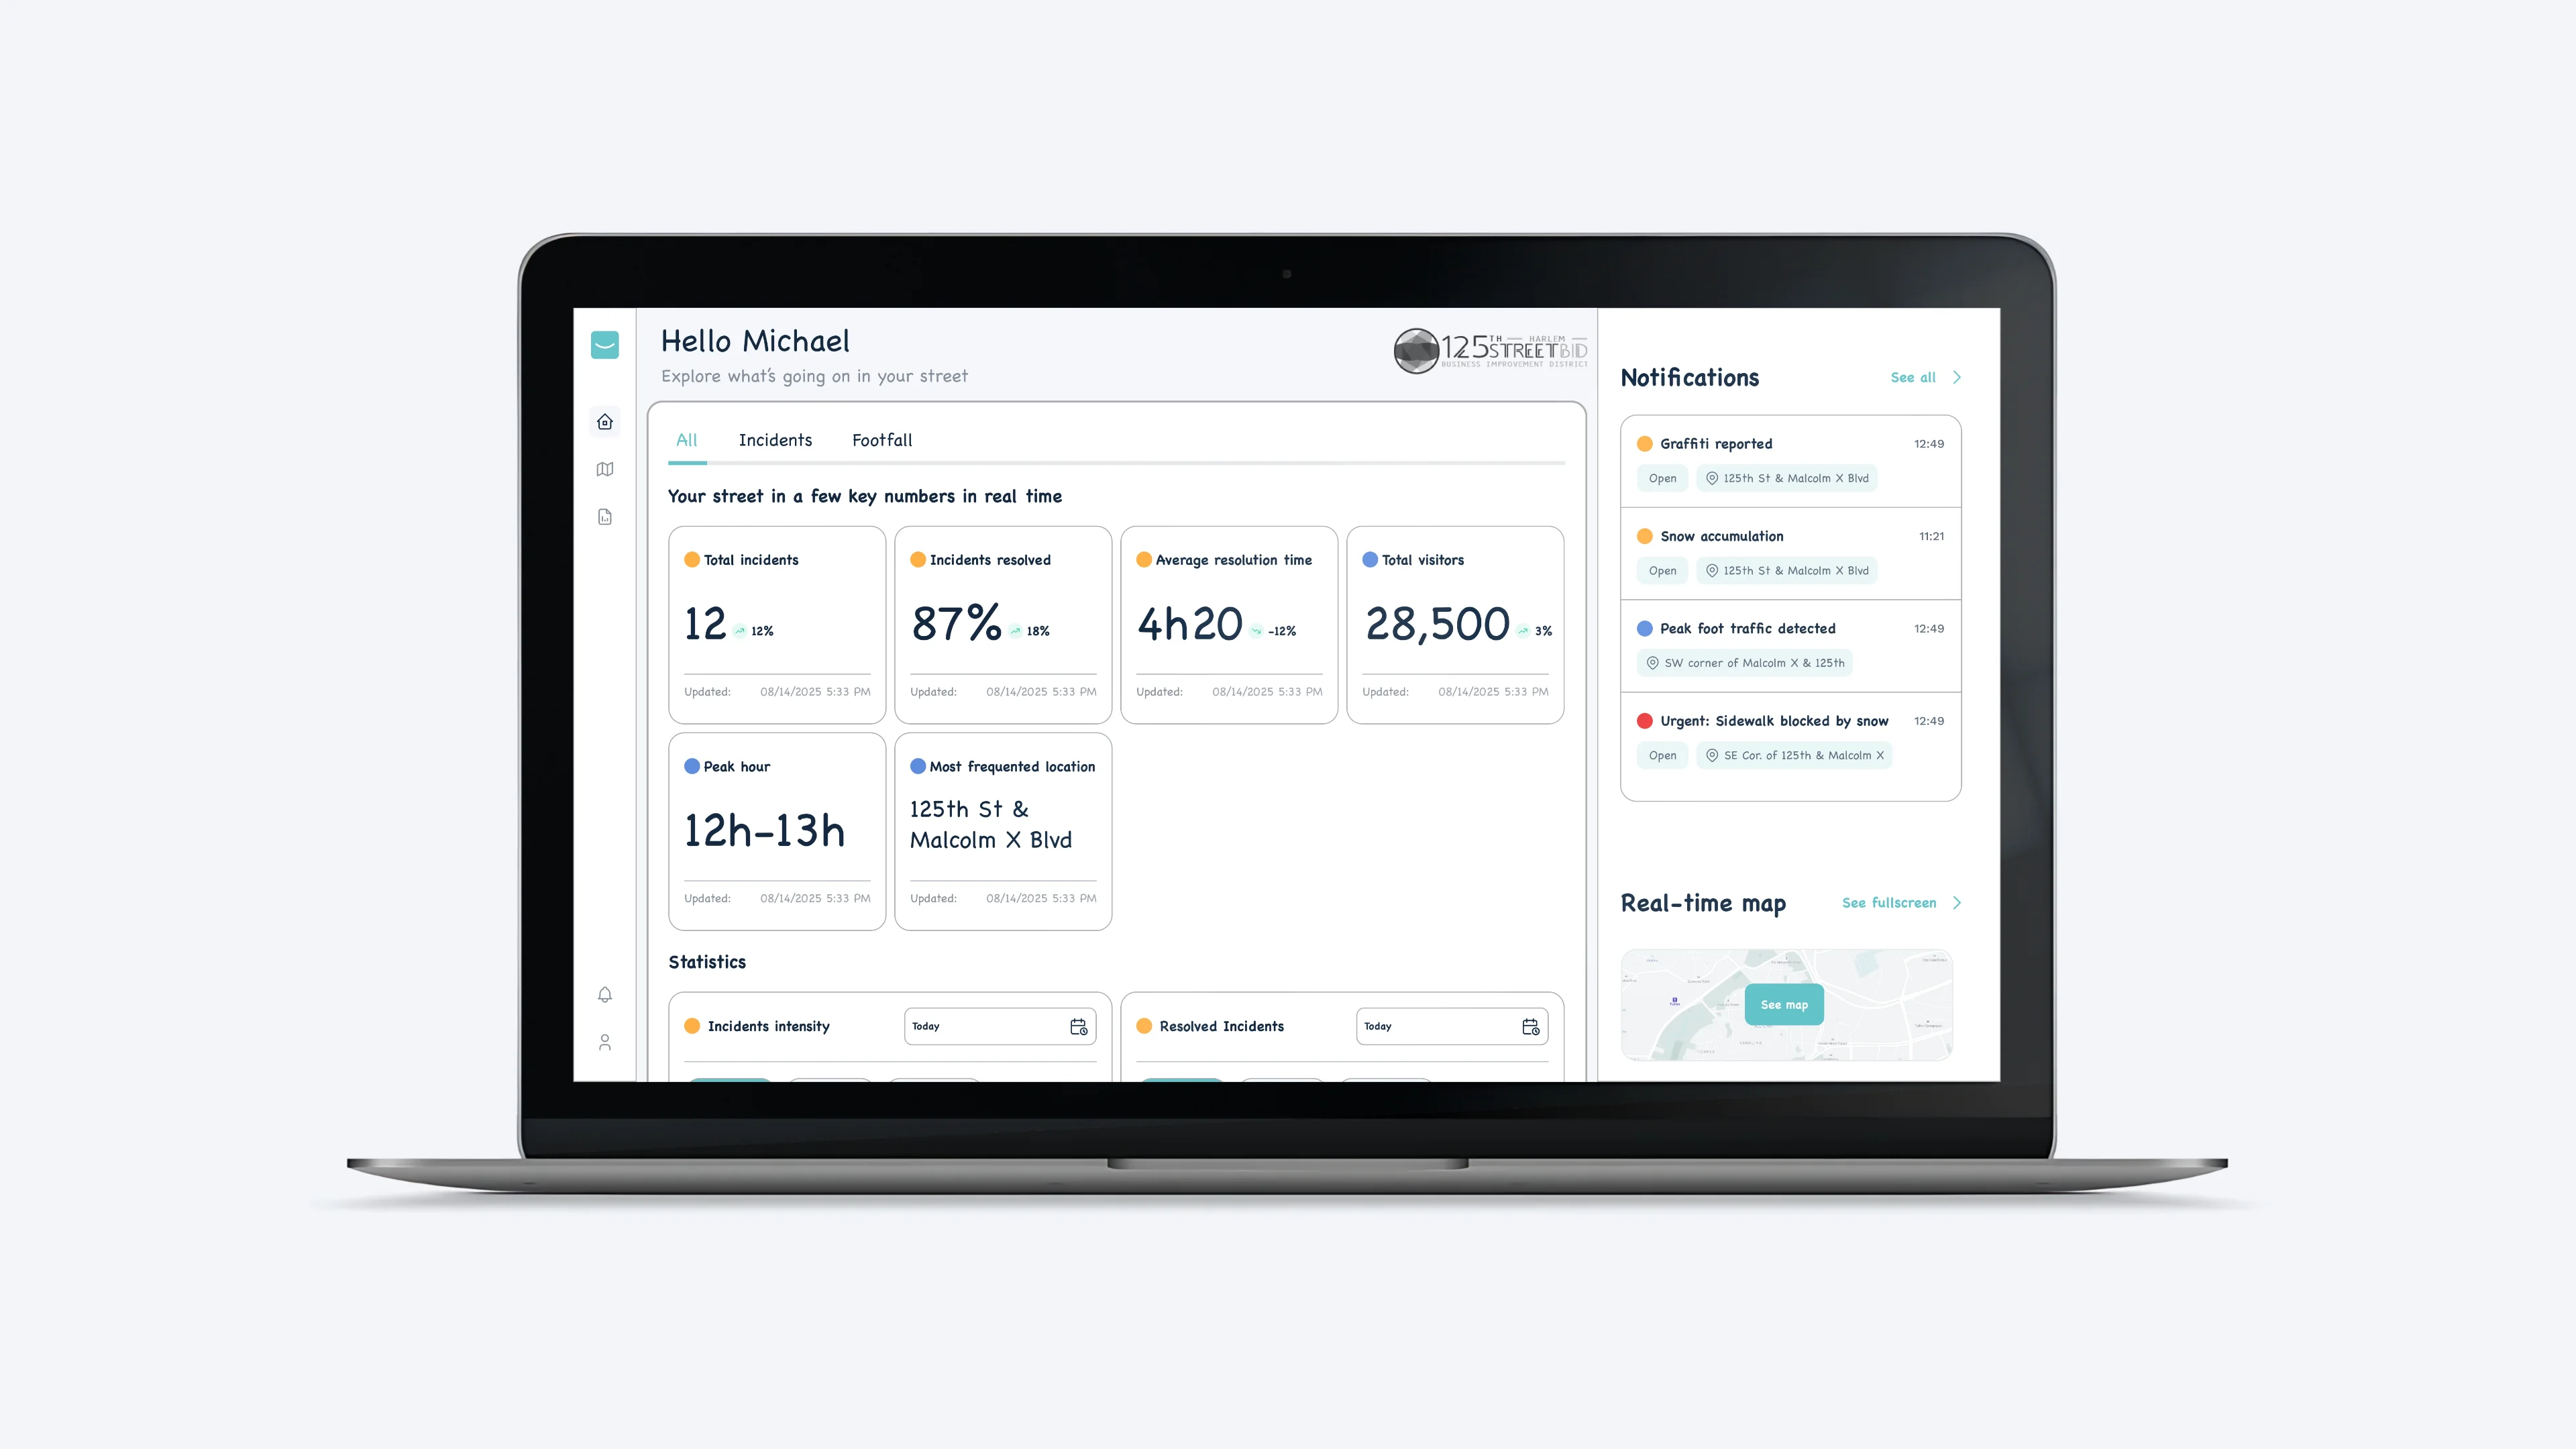
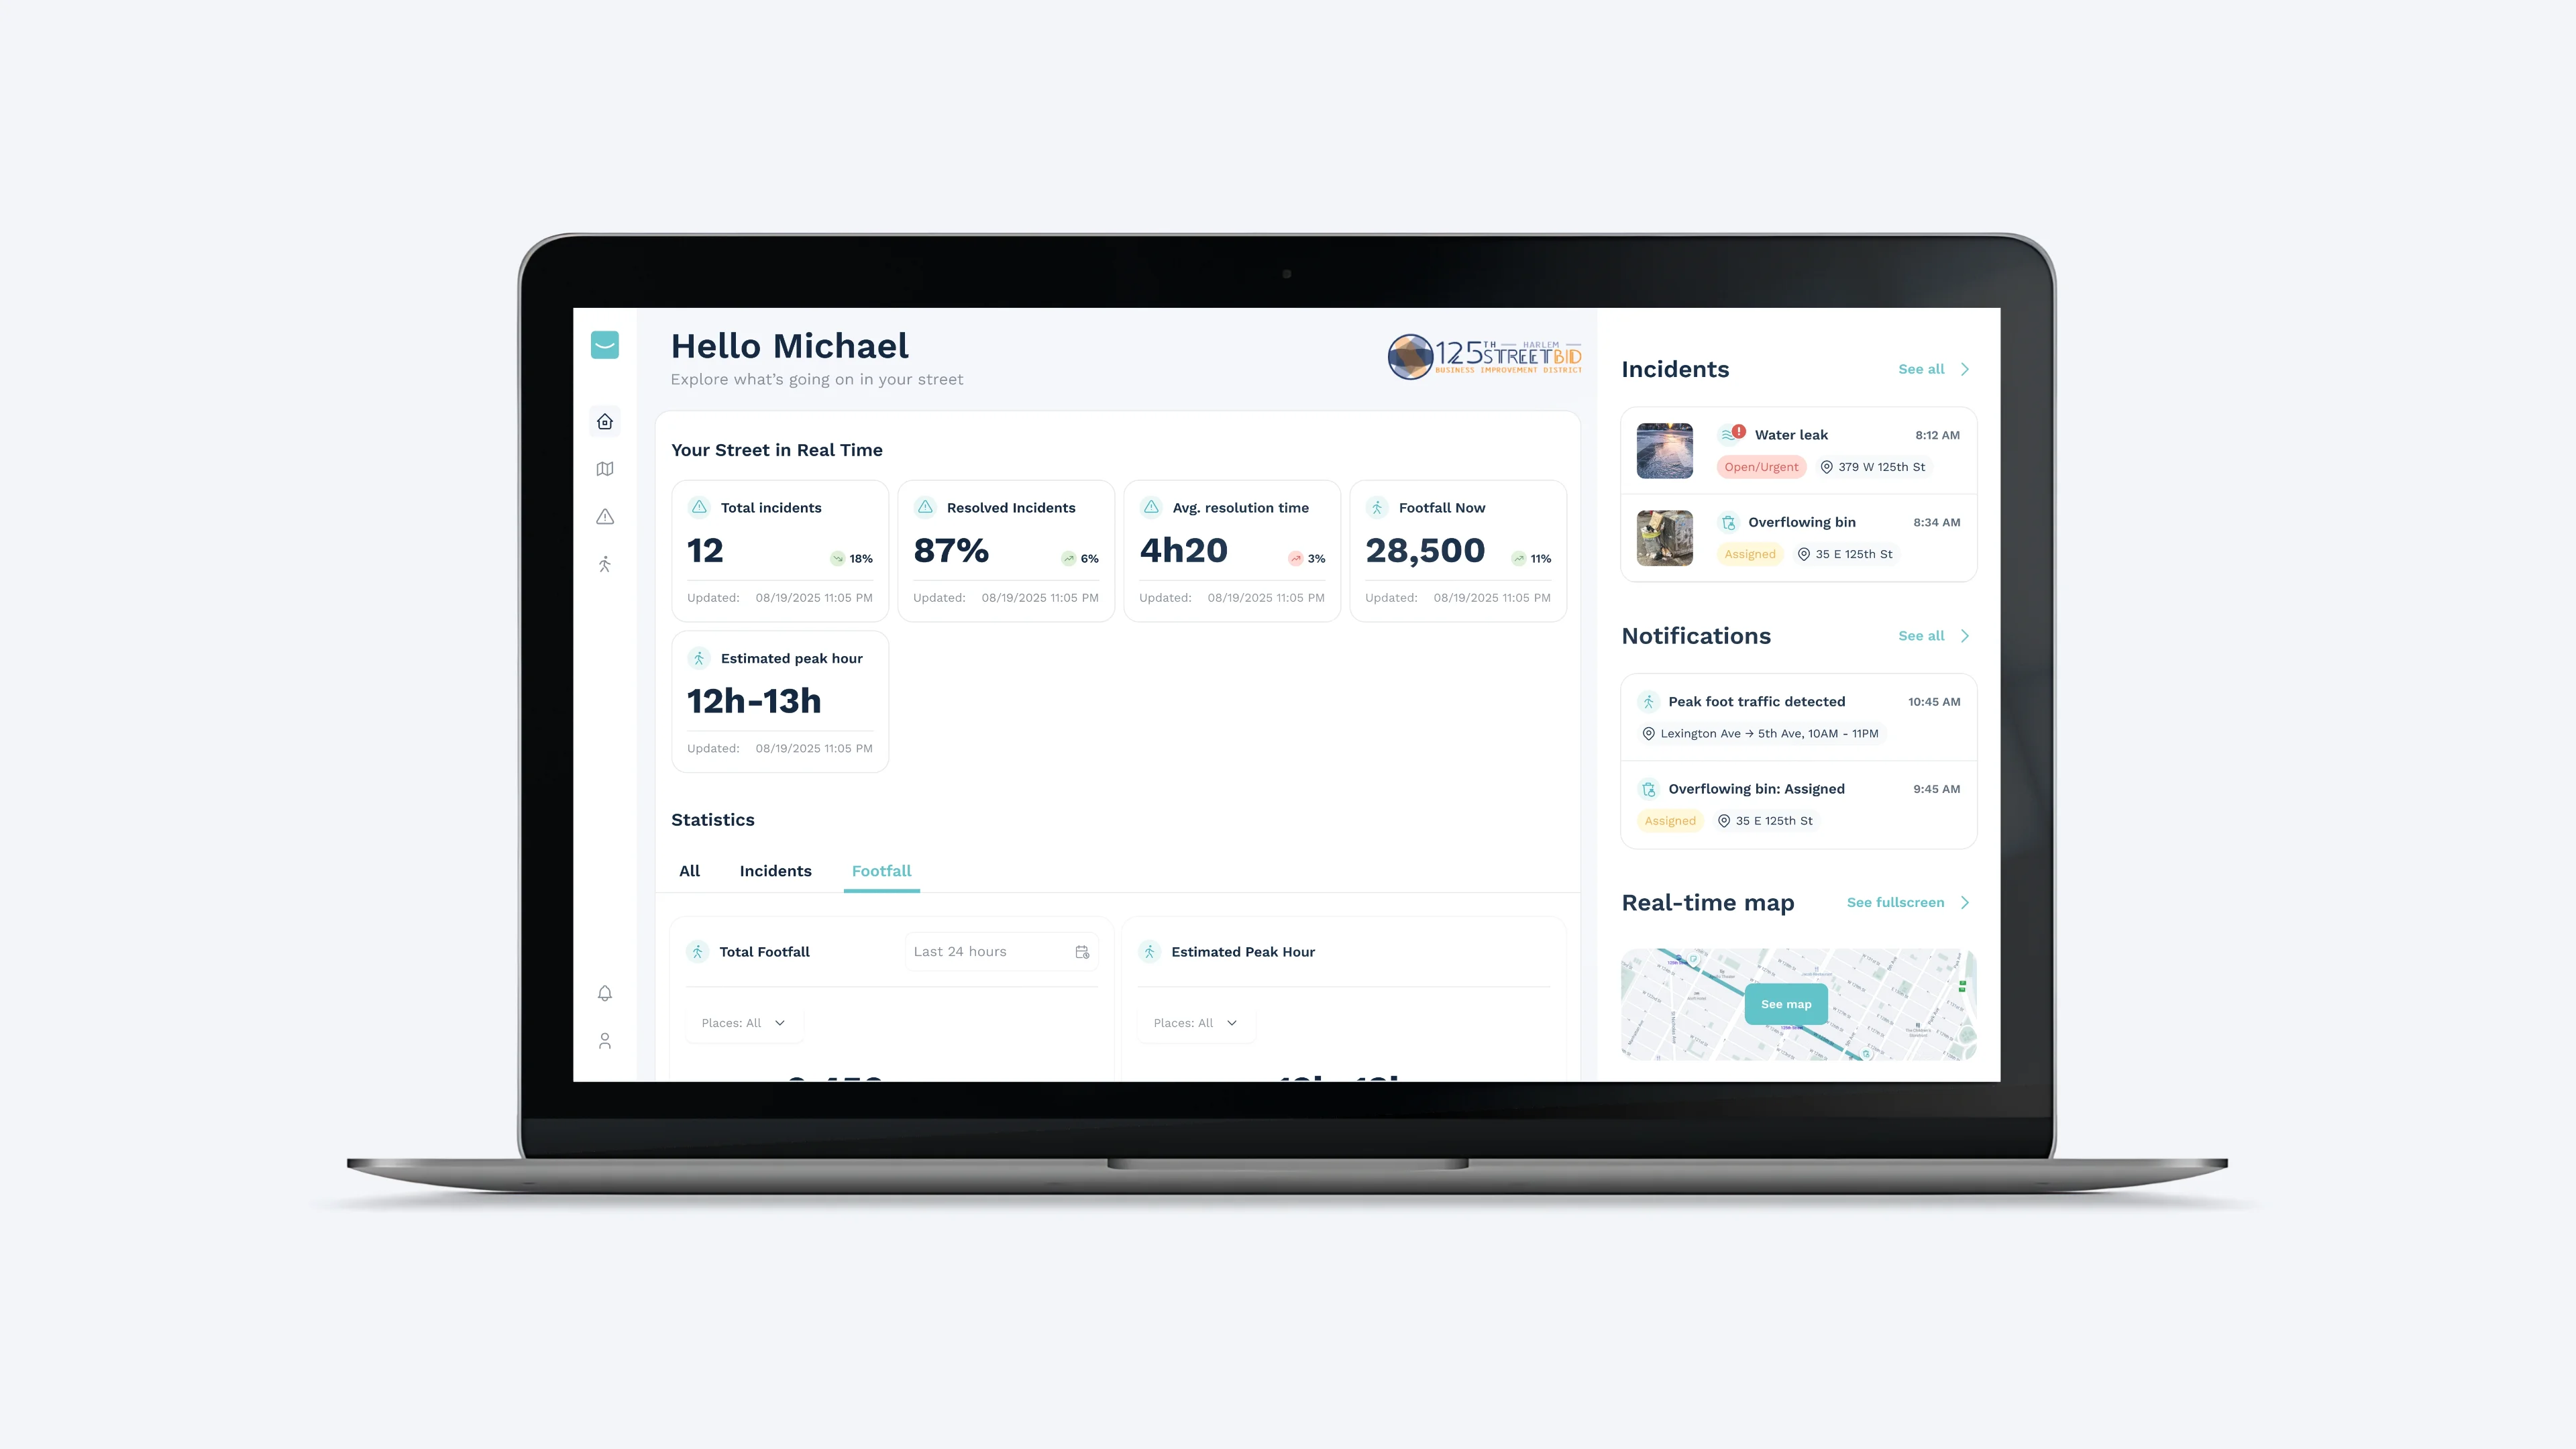
Creation of a dashboard bringing together the main KPIs related to incidents and pedestrian footfall, with several charts allowing teams to quickly analyse trends and activity across the area.
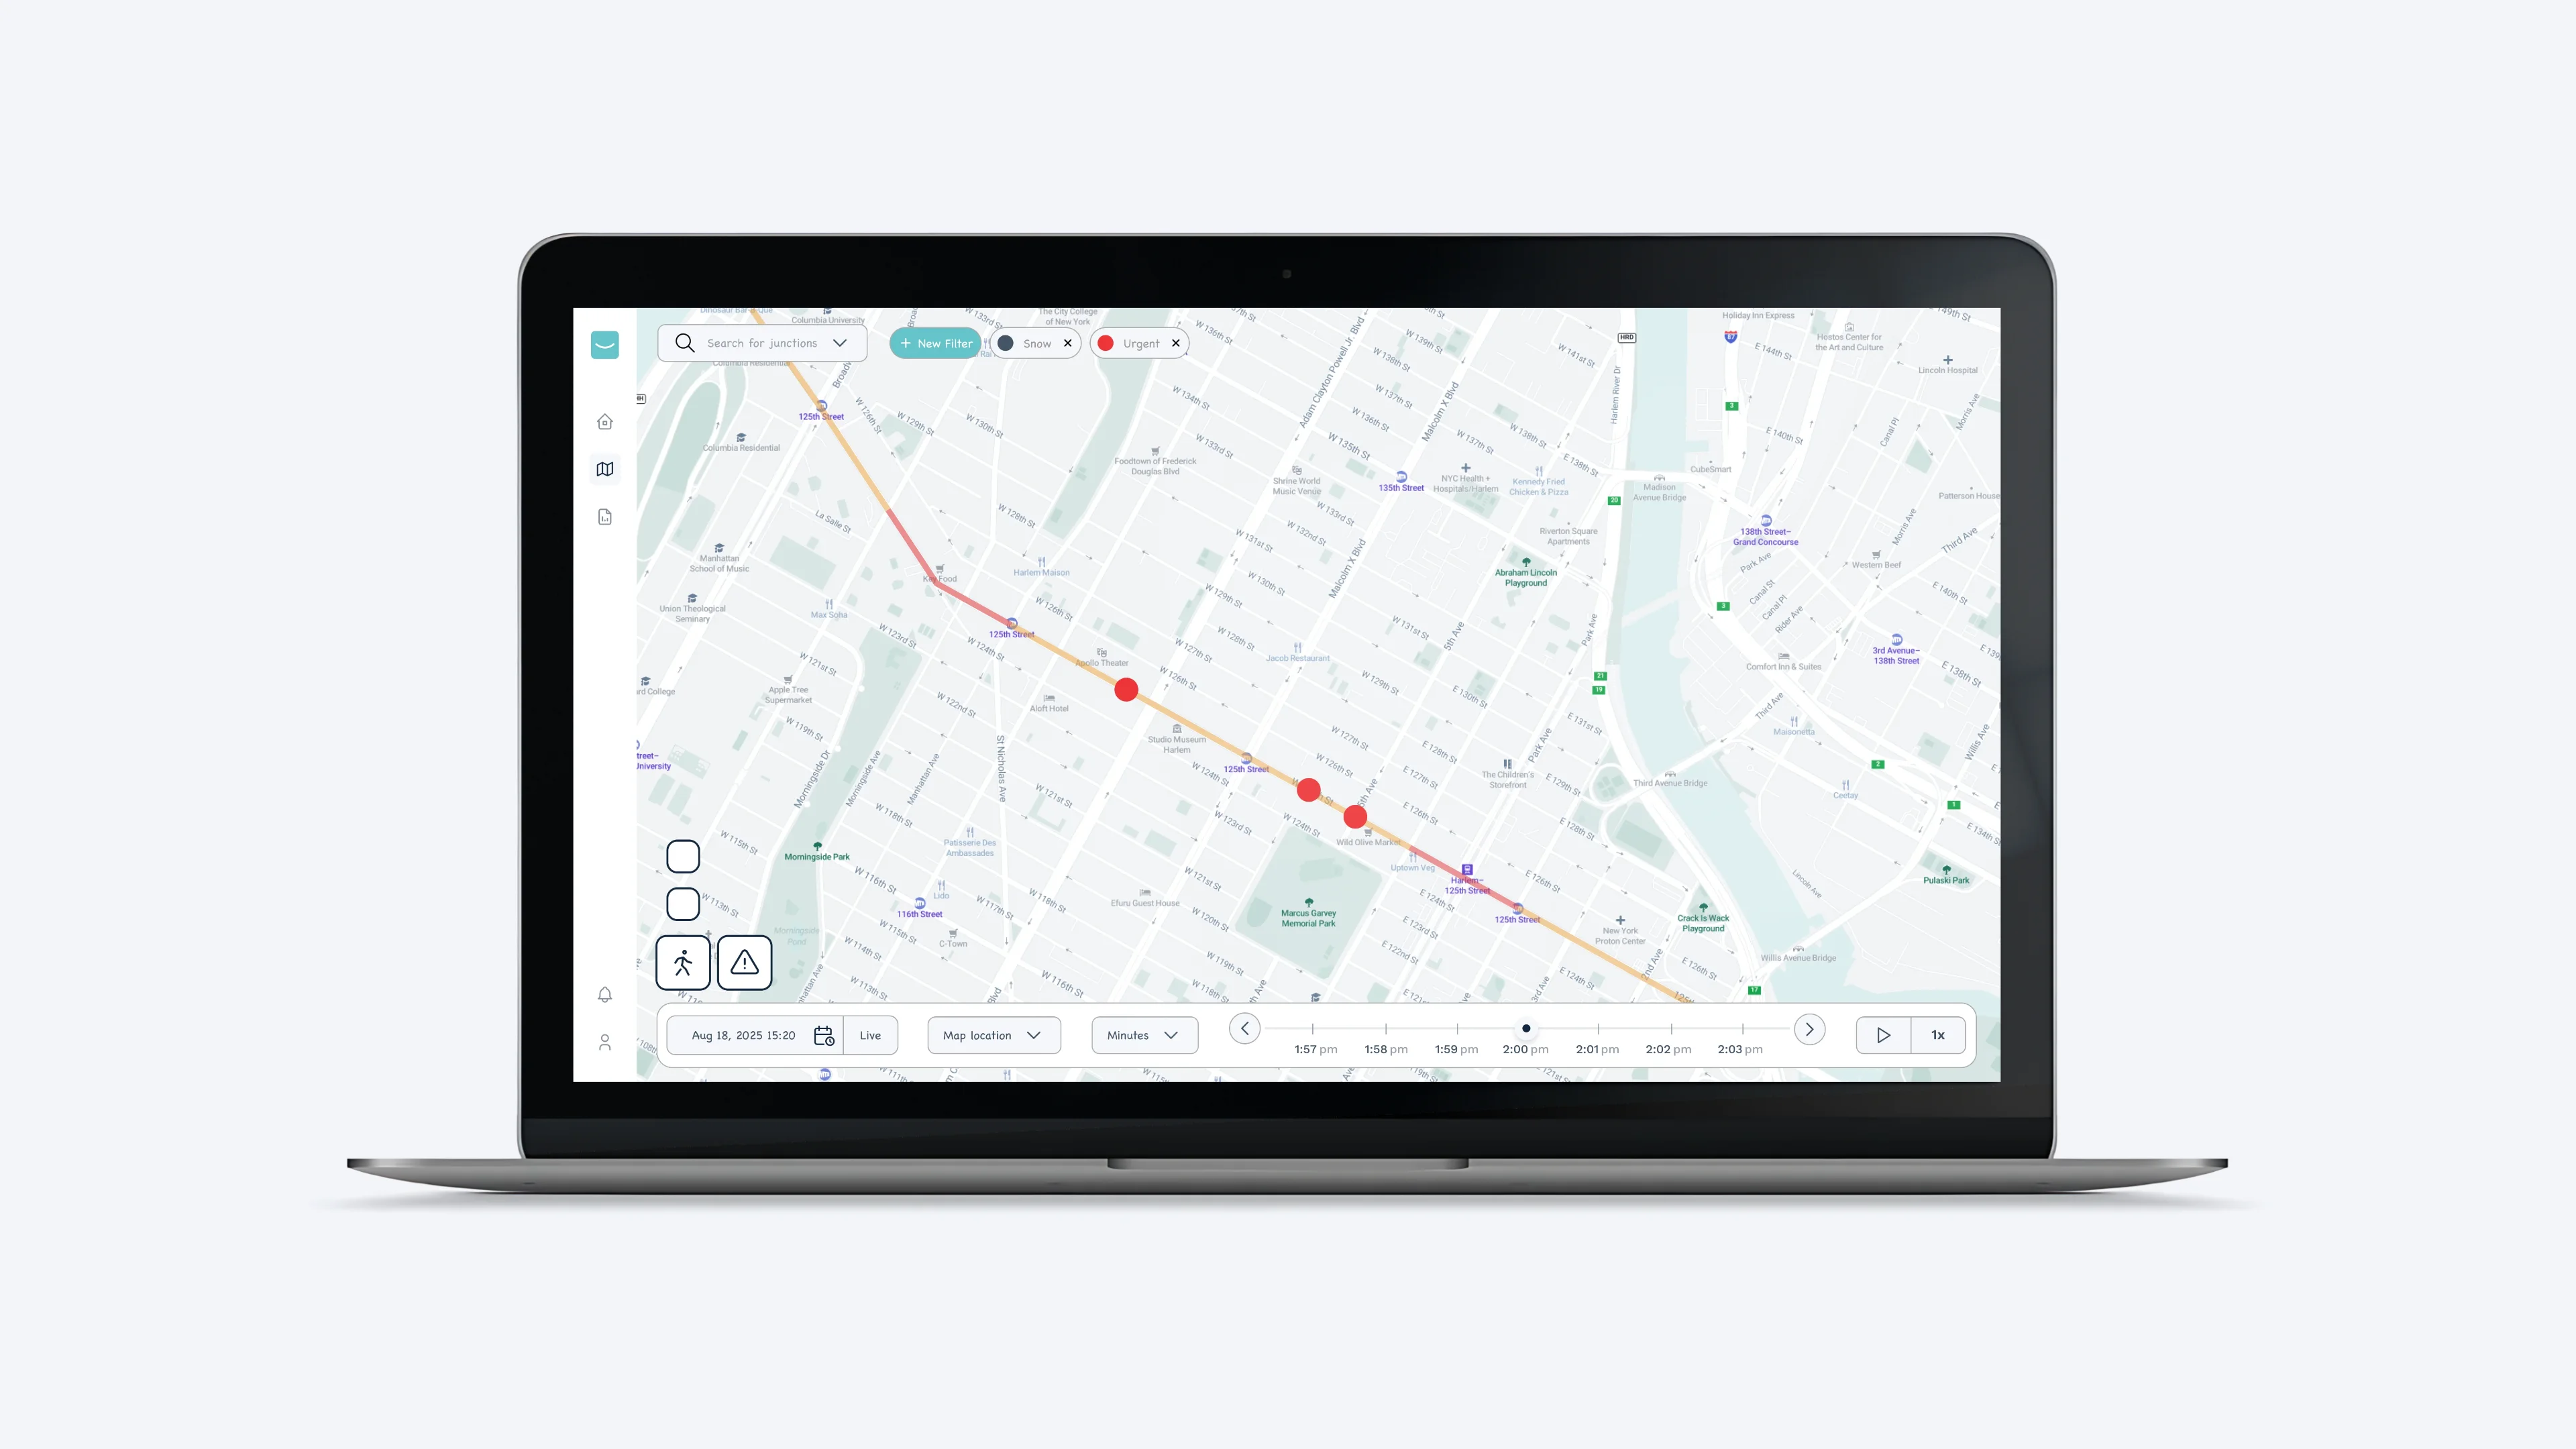
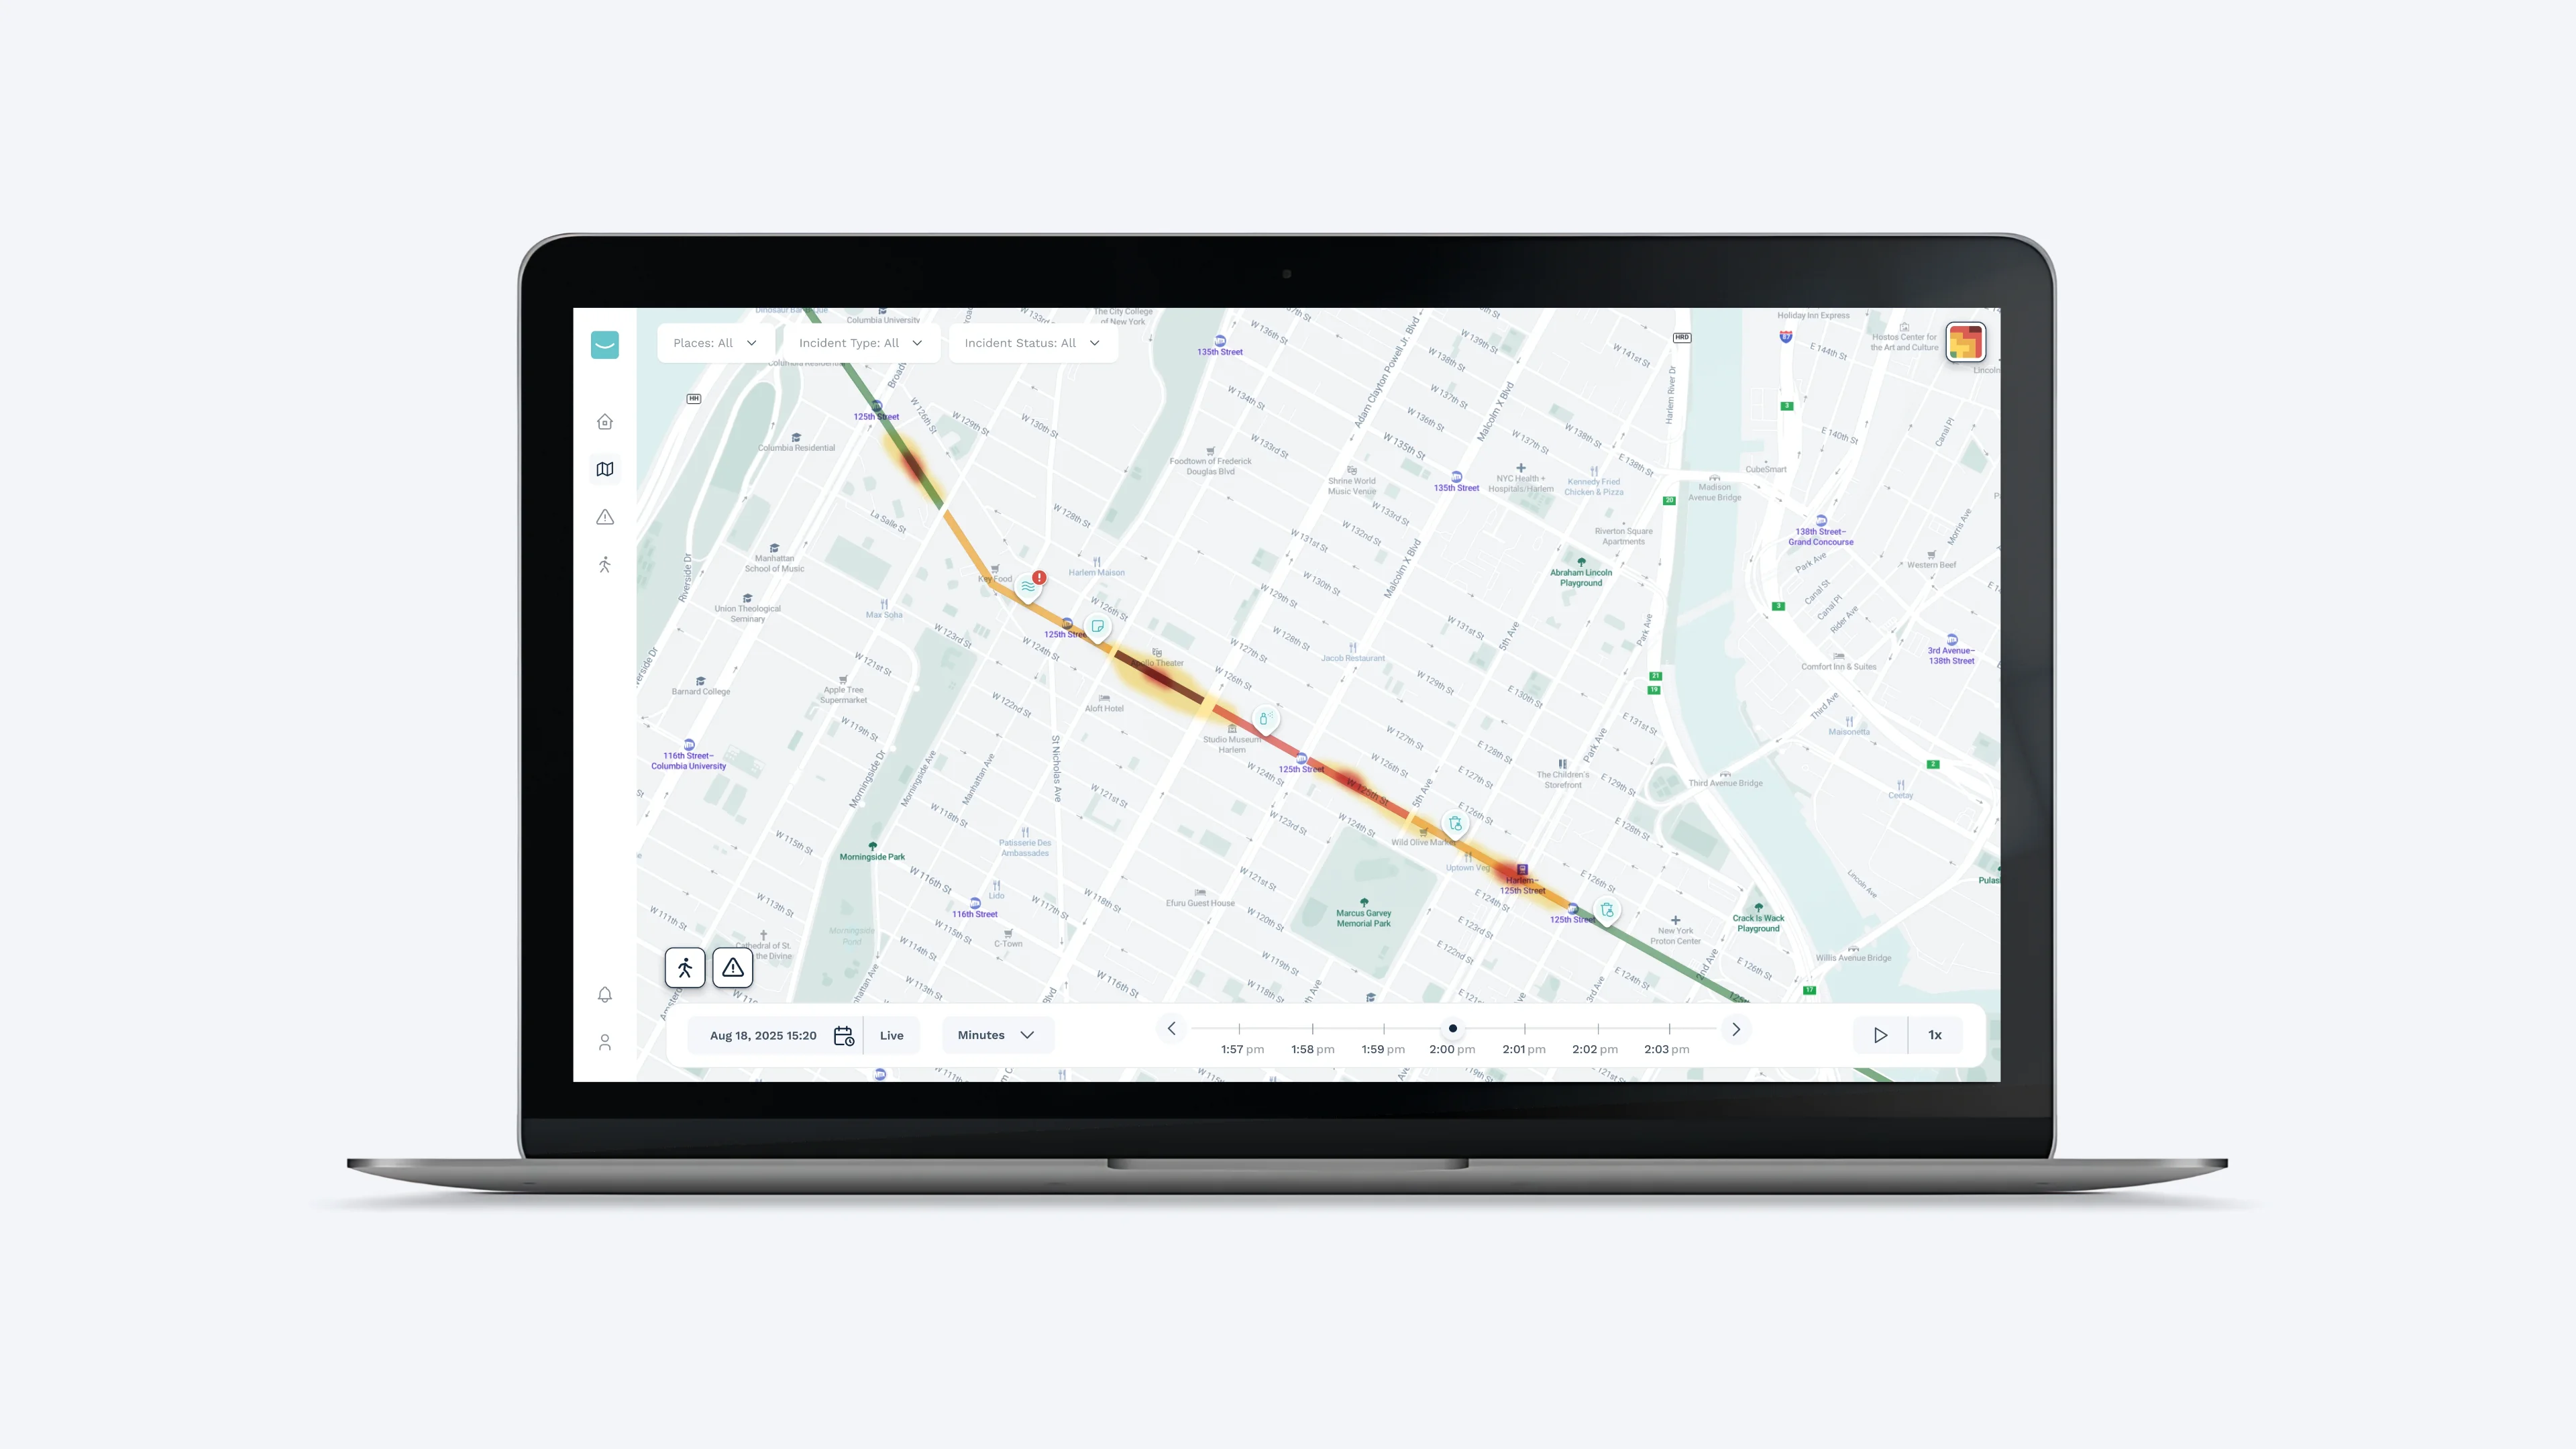
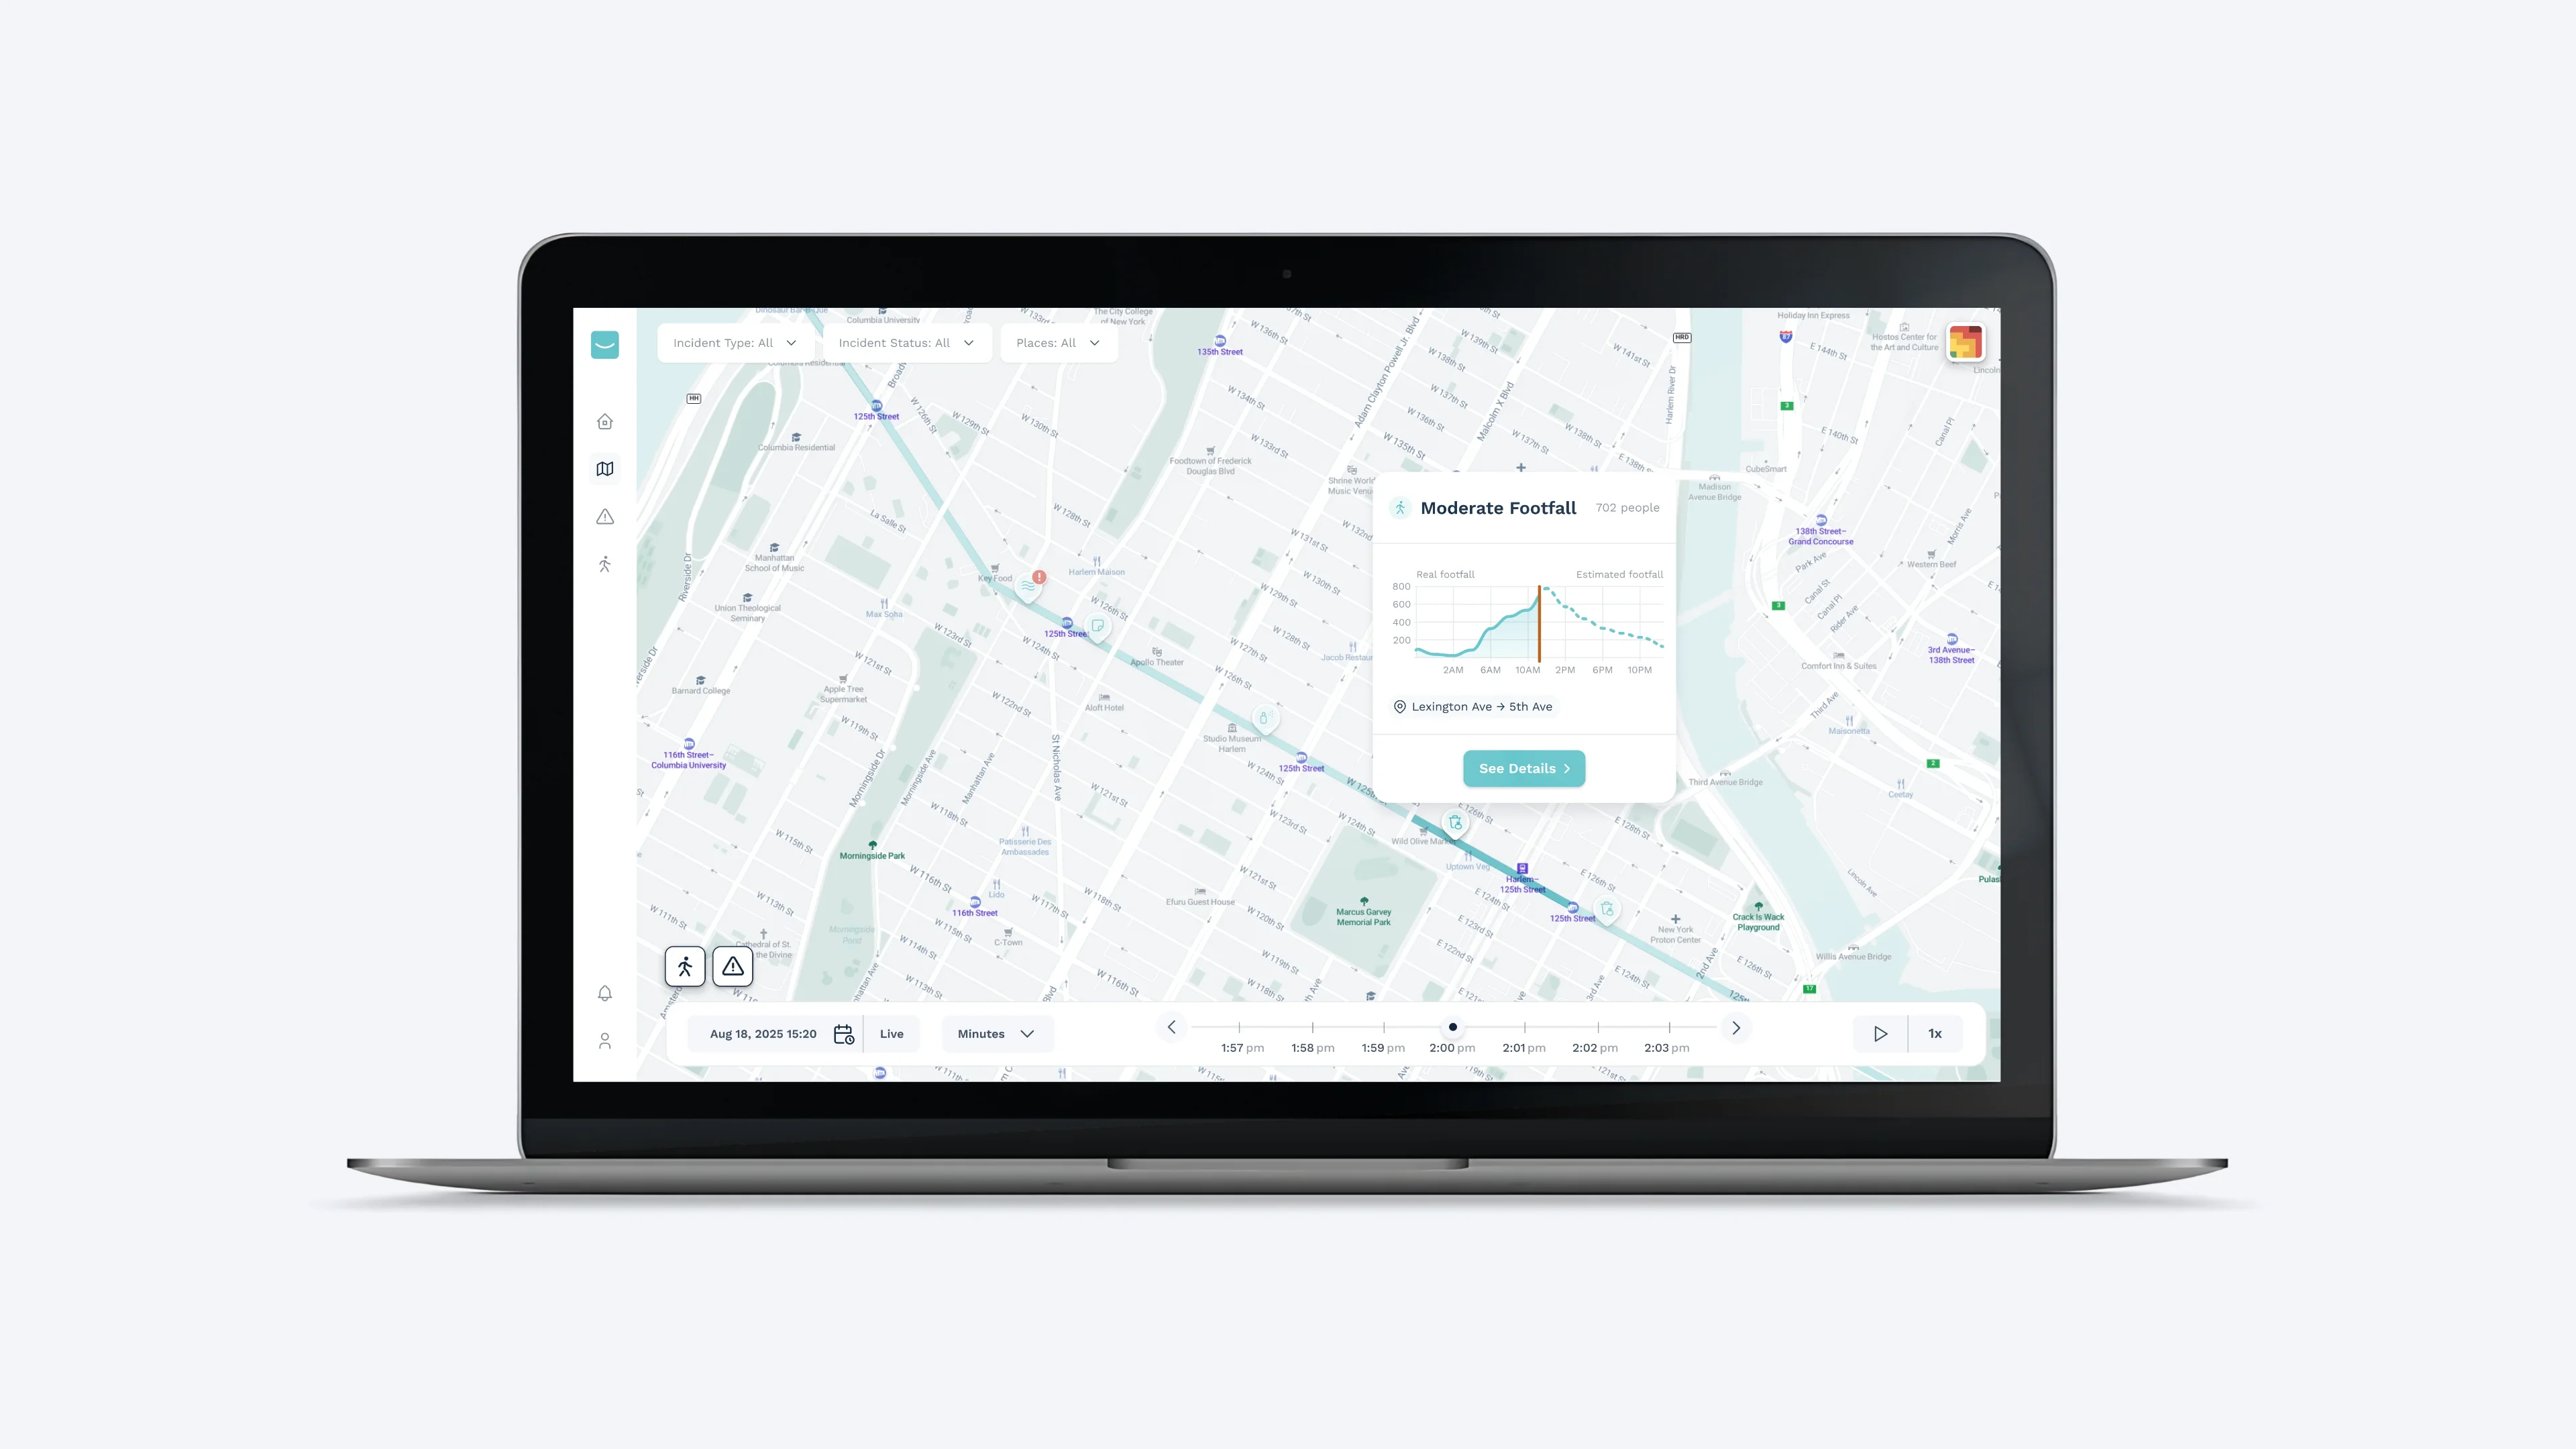
Design of an interactive map providing a real-time overview of incidents and pedestrian footfall along 125th Street. Each incident is represented by an icon based on its type. Pedestrian footfall is divided into sections between the different streets to visualise pedestrian flows. Filters allow users to customise the view by data type, date, category, priority or status.
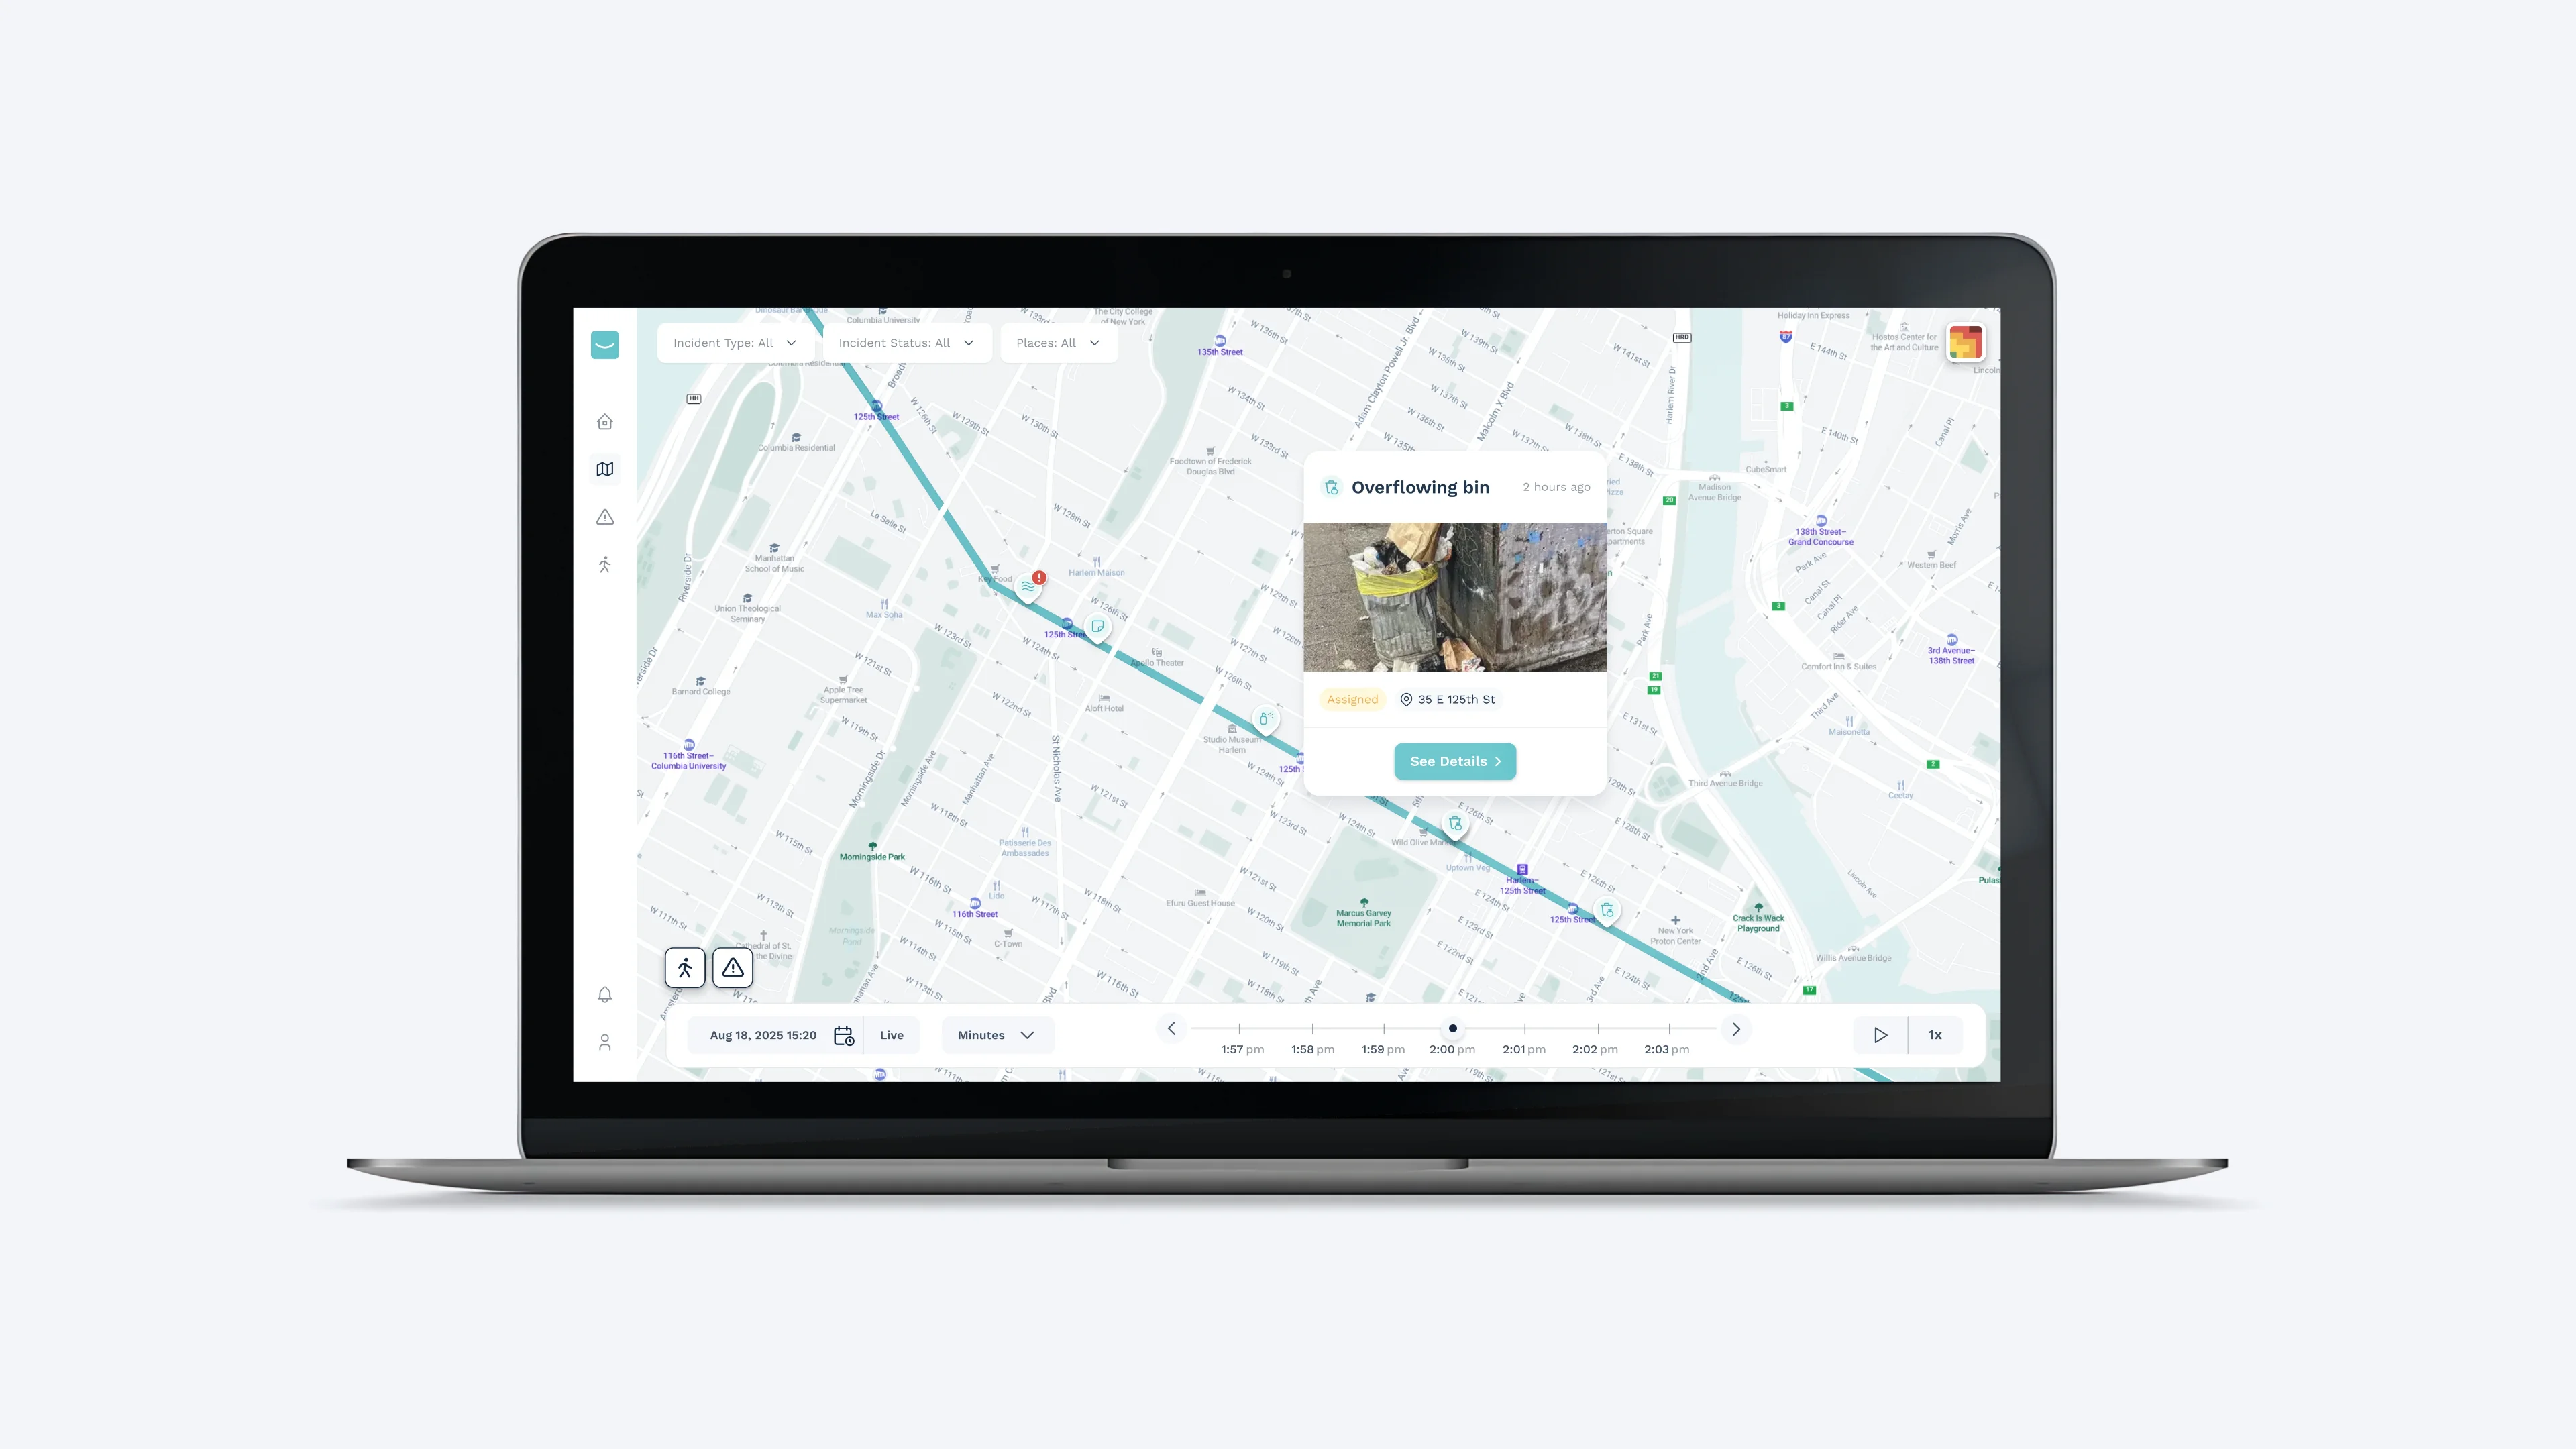
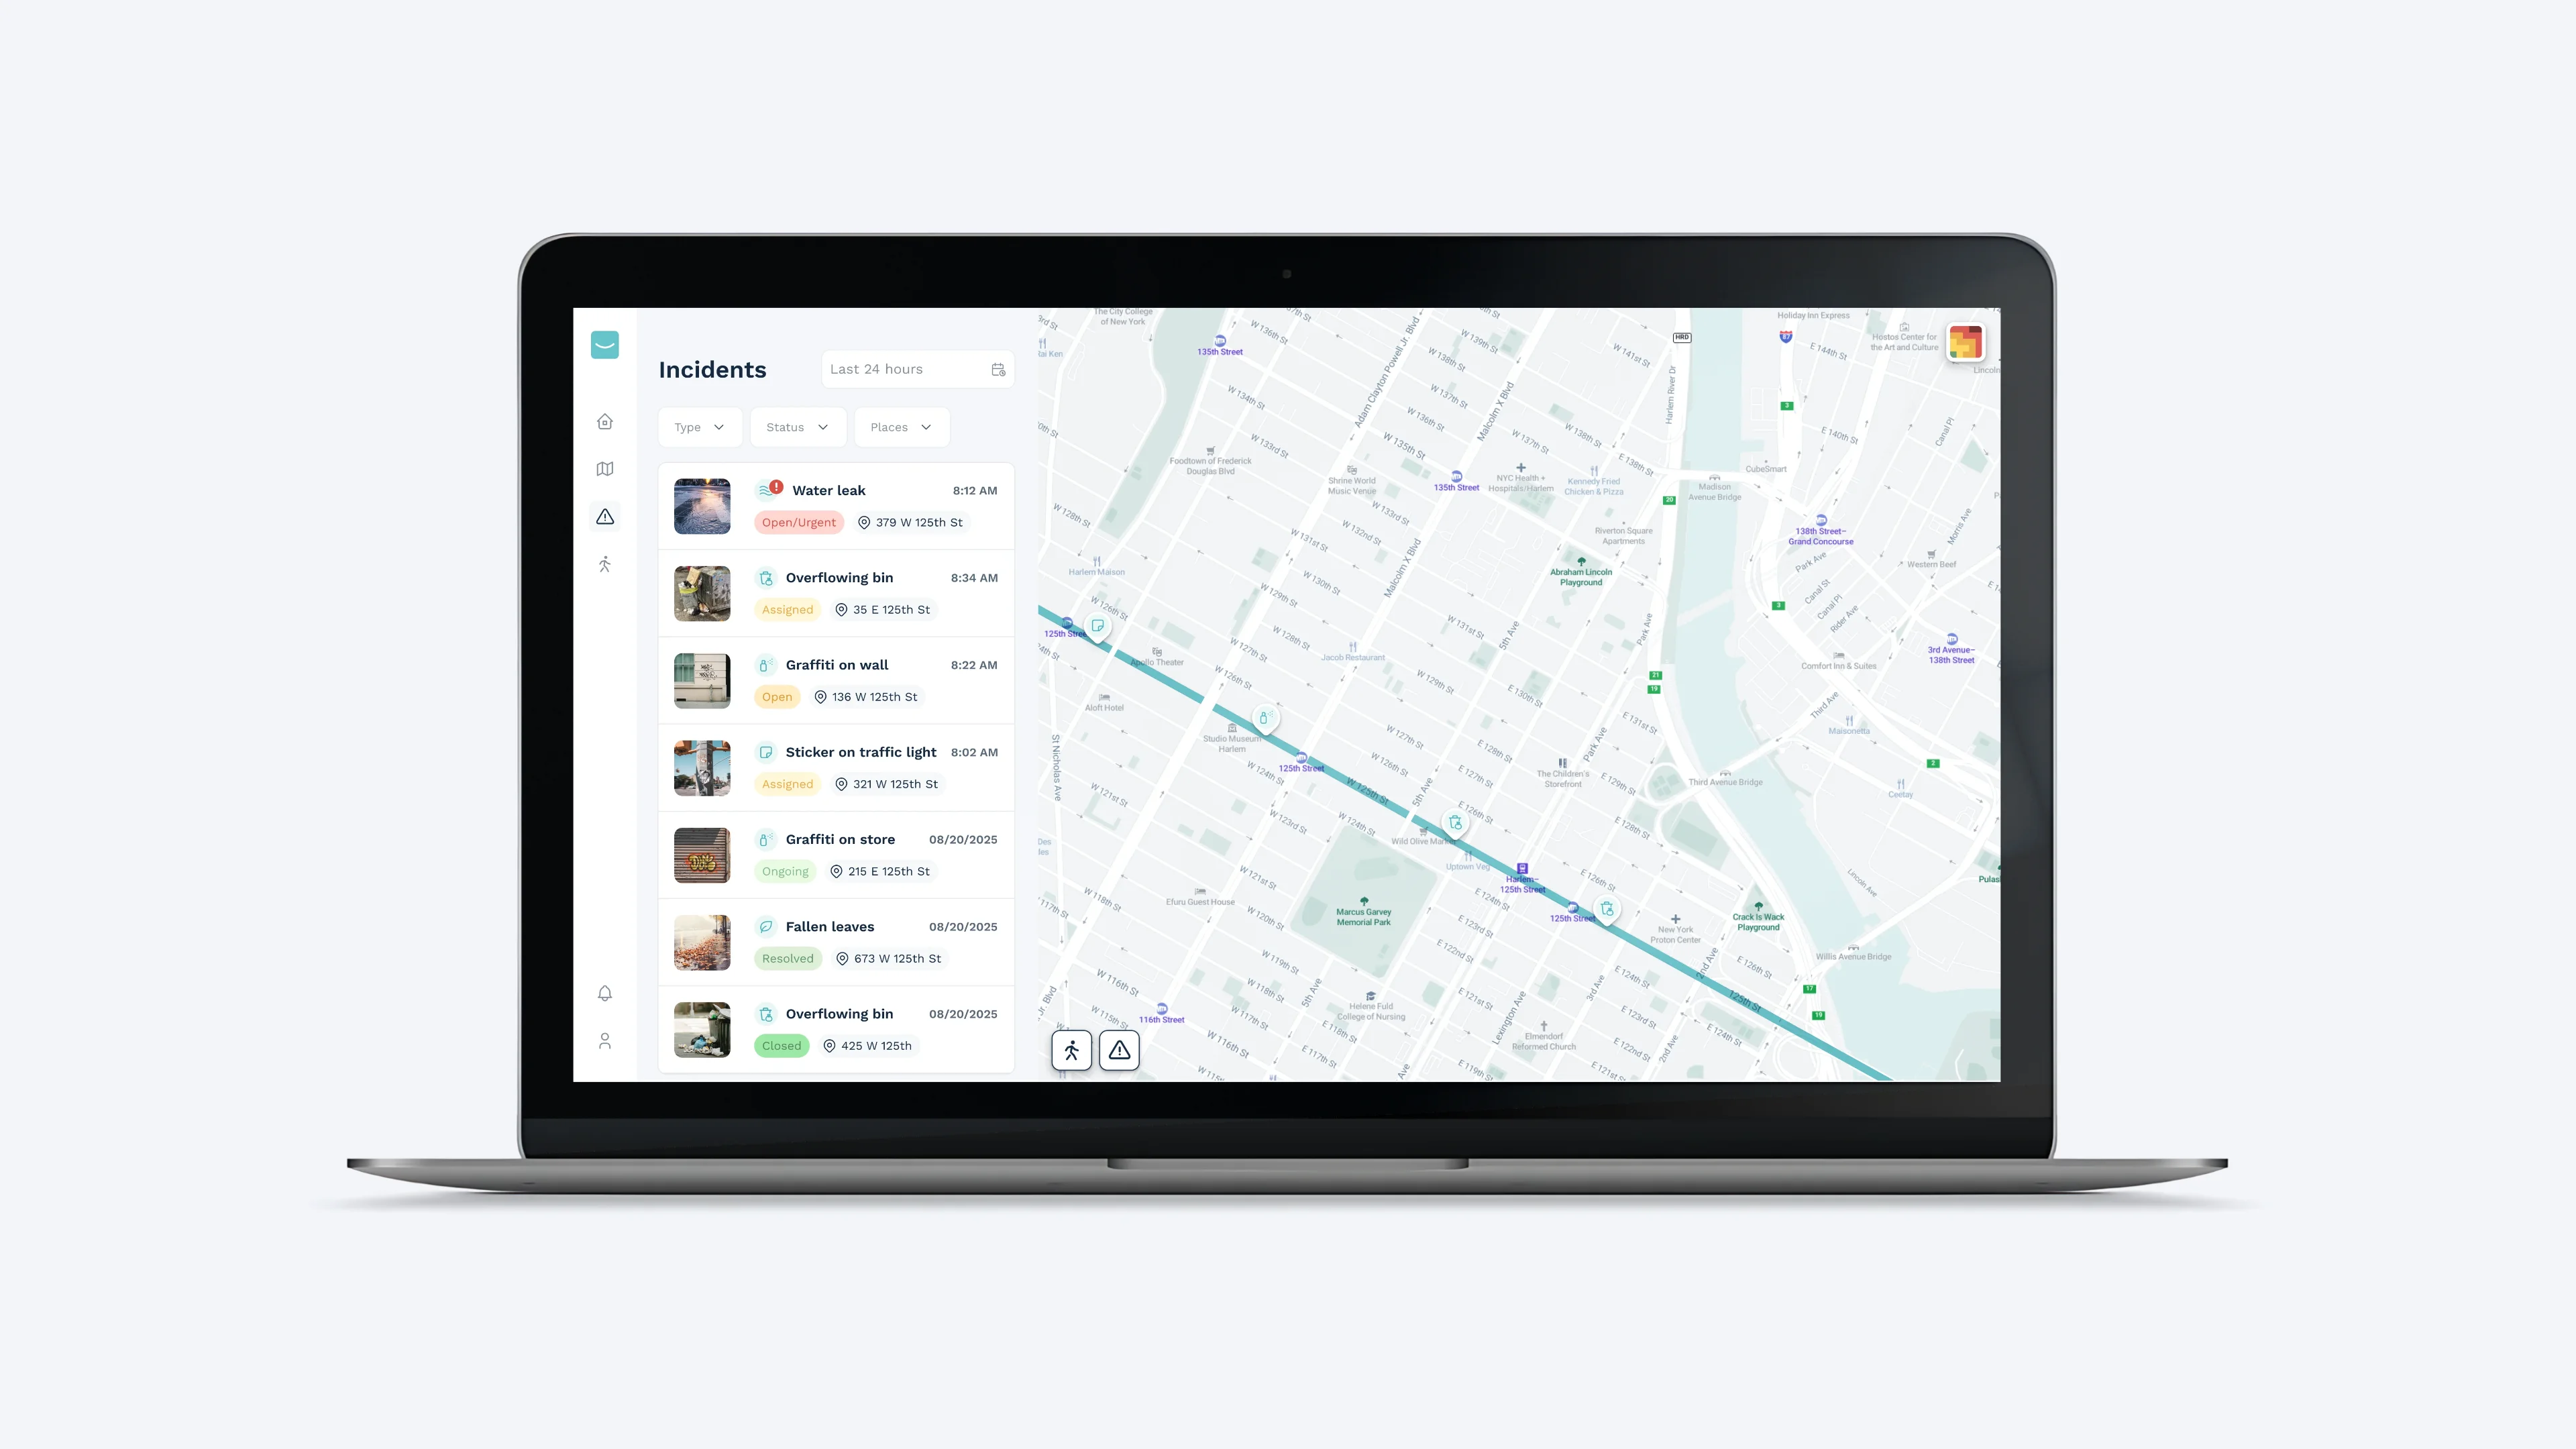
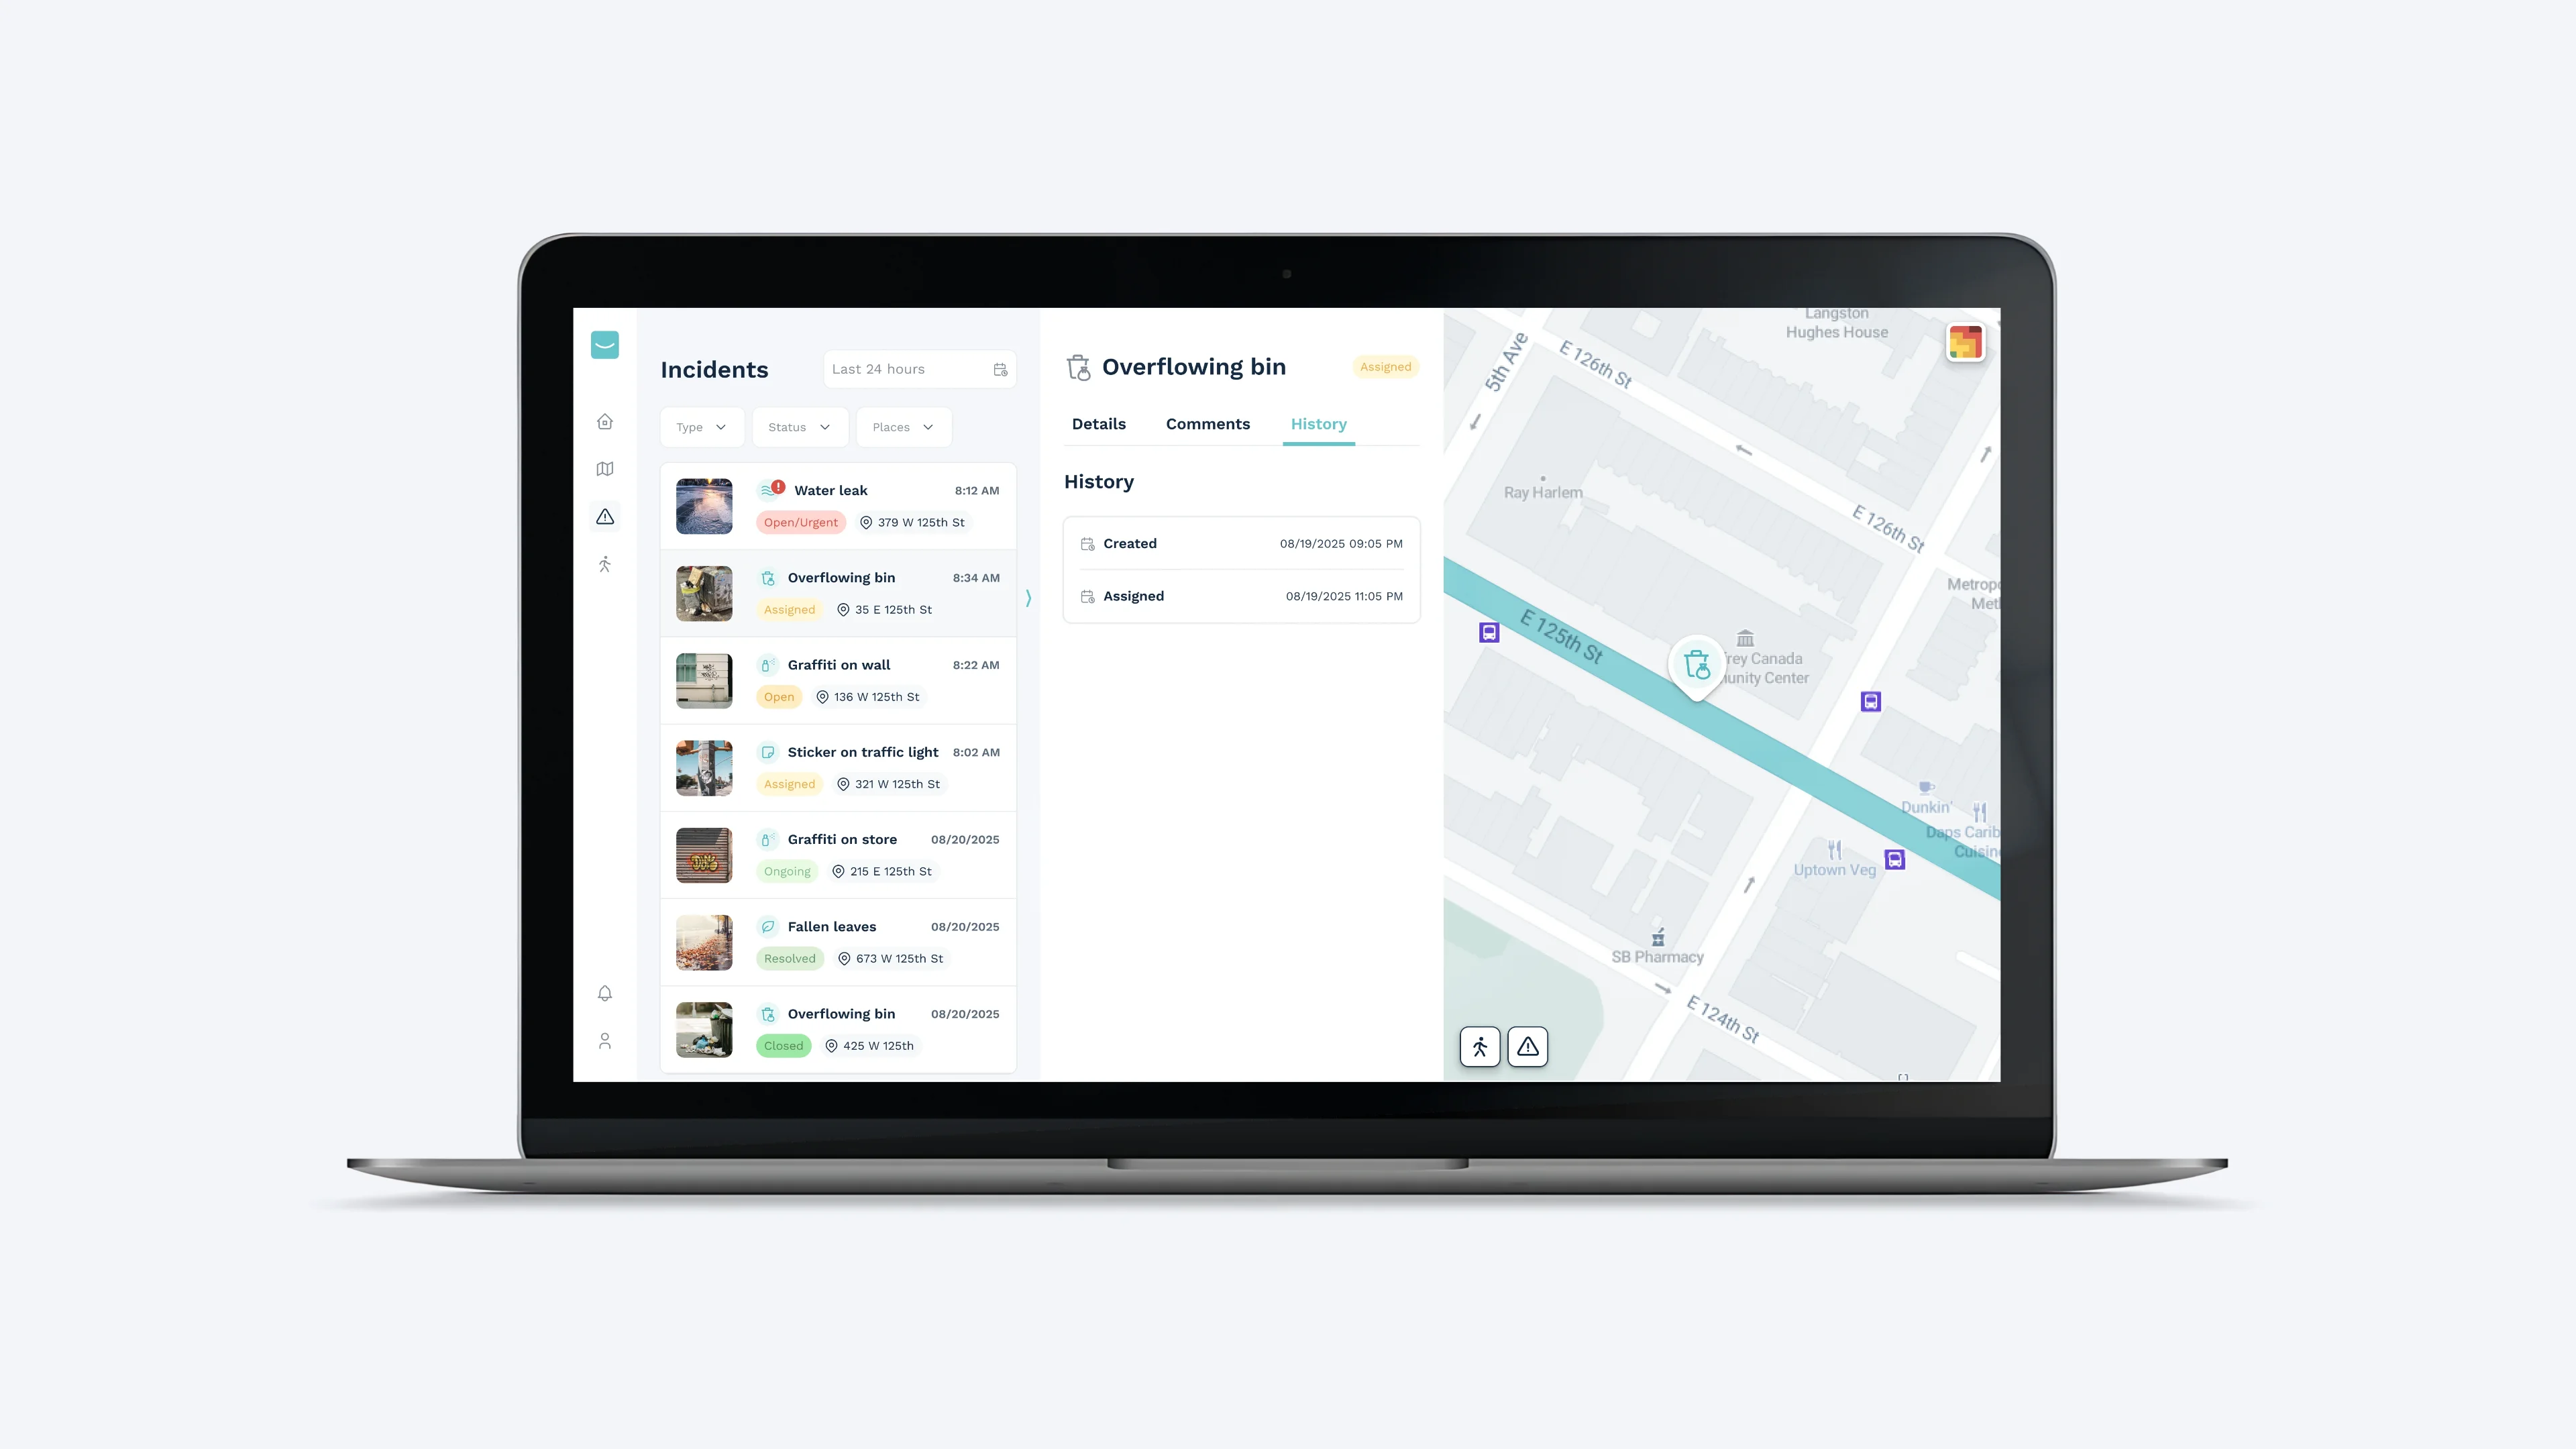
Teams can view open incidents, track their status in real time and access detailed information. Once an intervention has been completed, an incident can be marked as resolved and documented. Filters by date, category, priority and status also allow users to quickly find specific incidents.
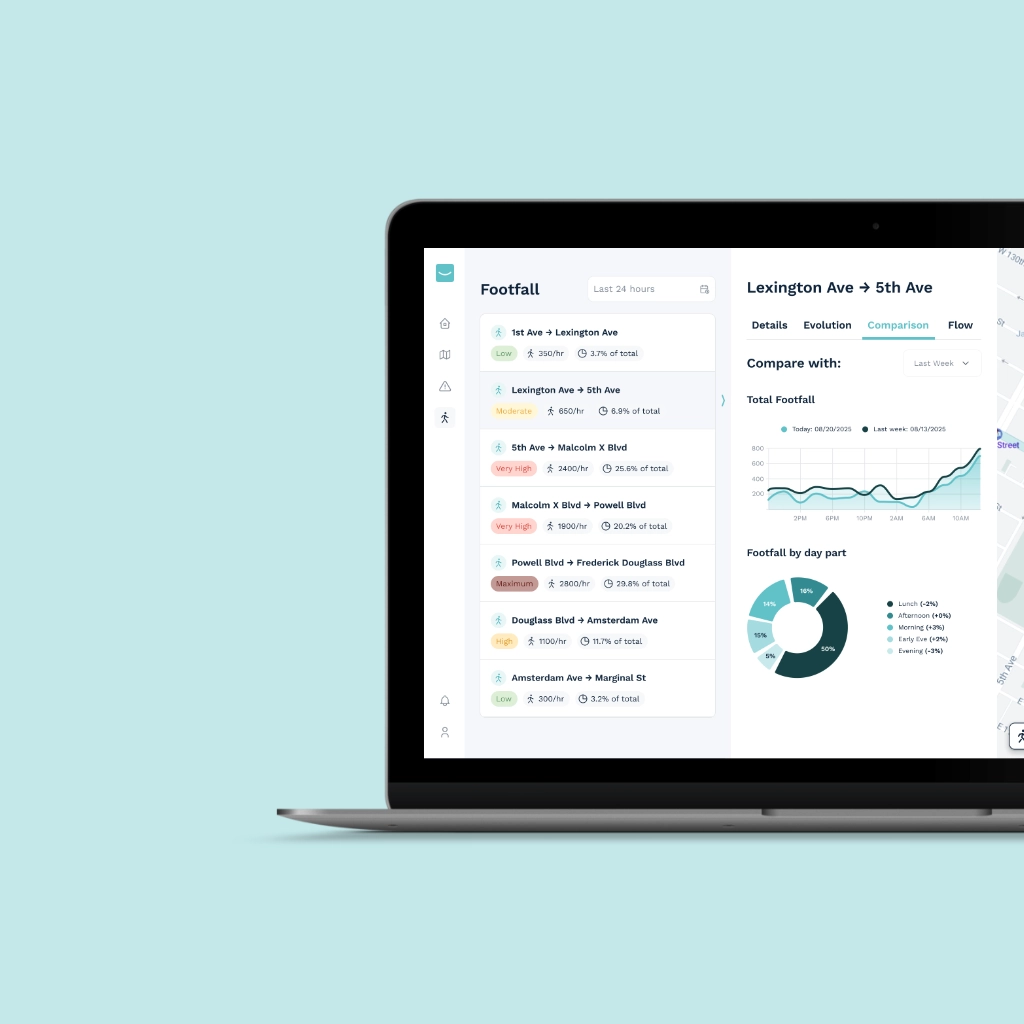
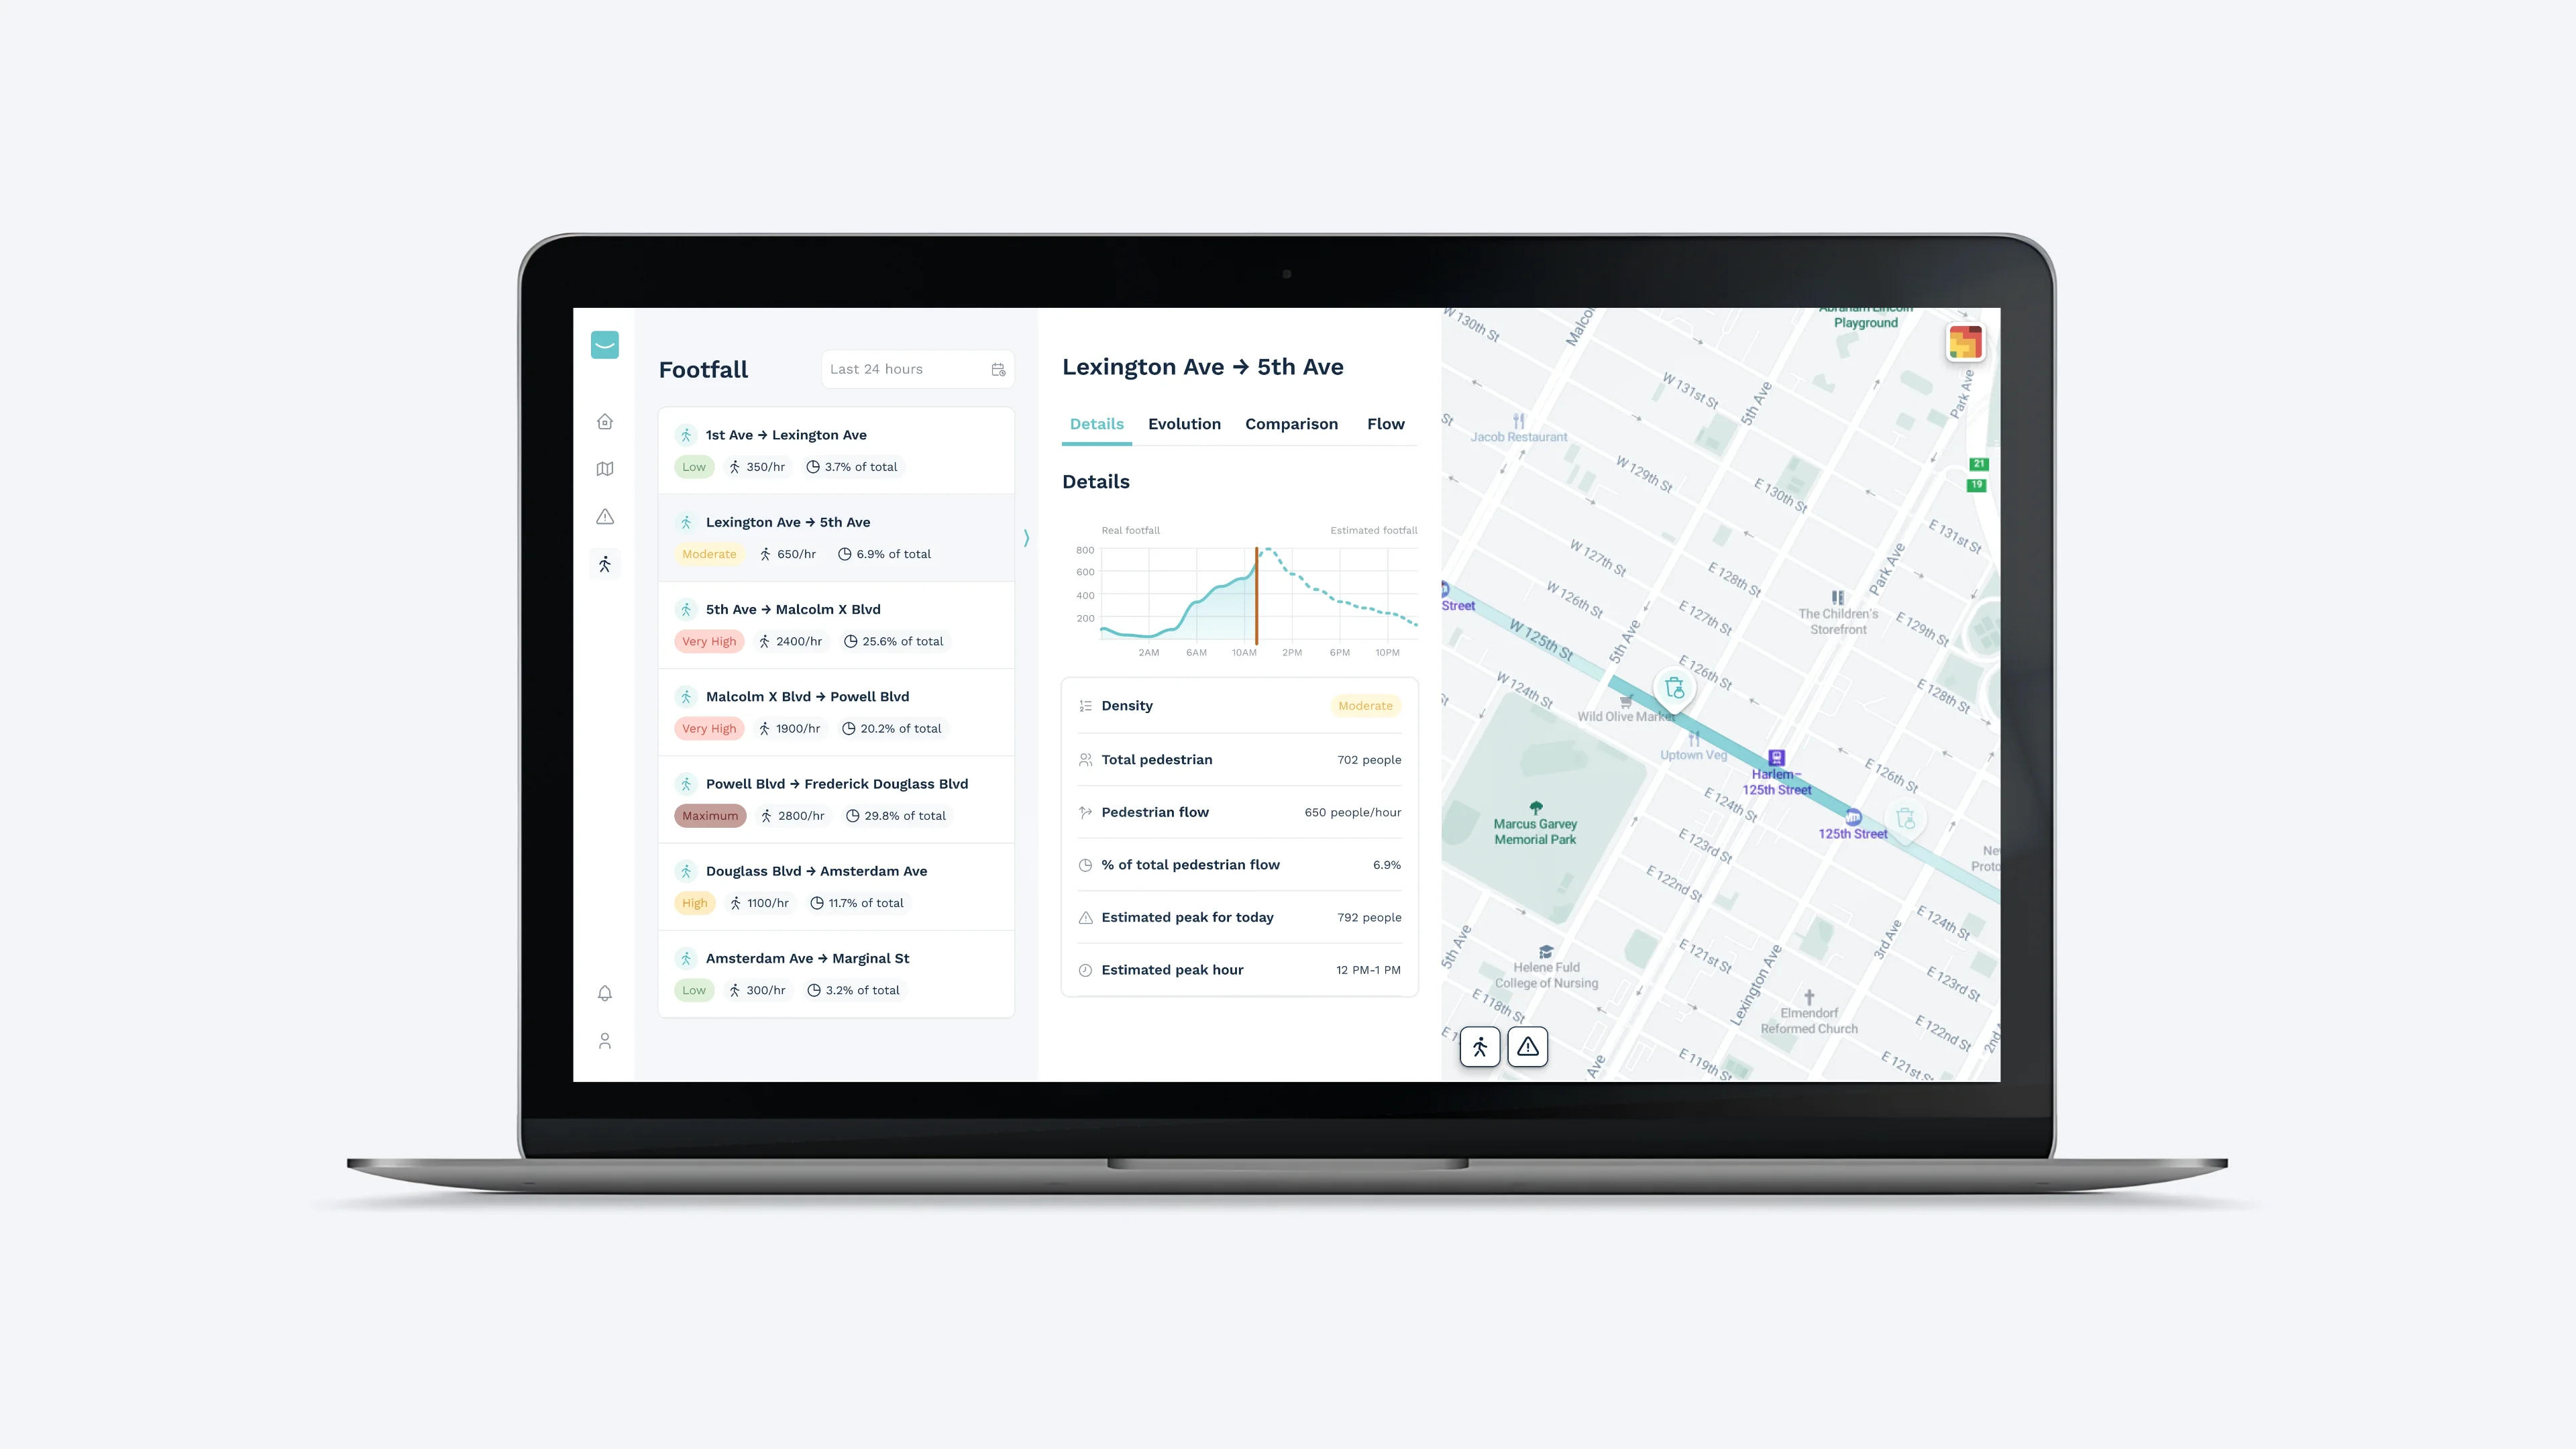
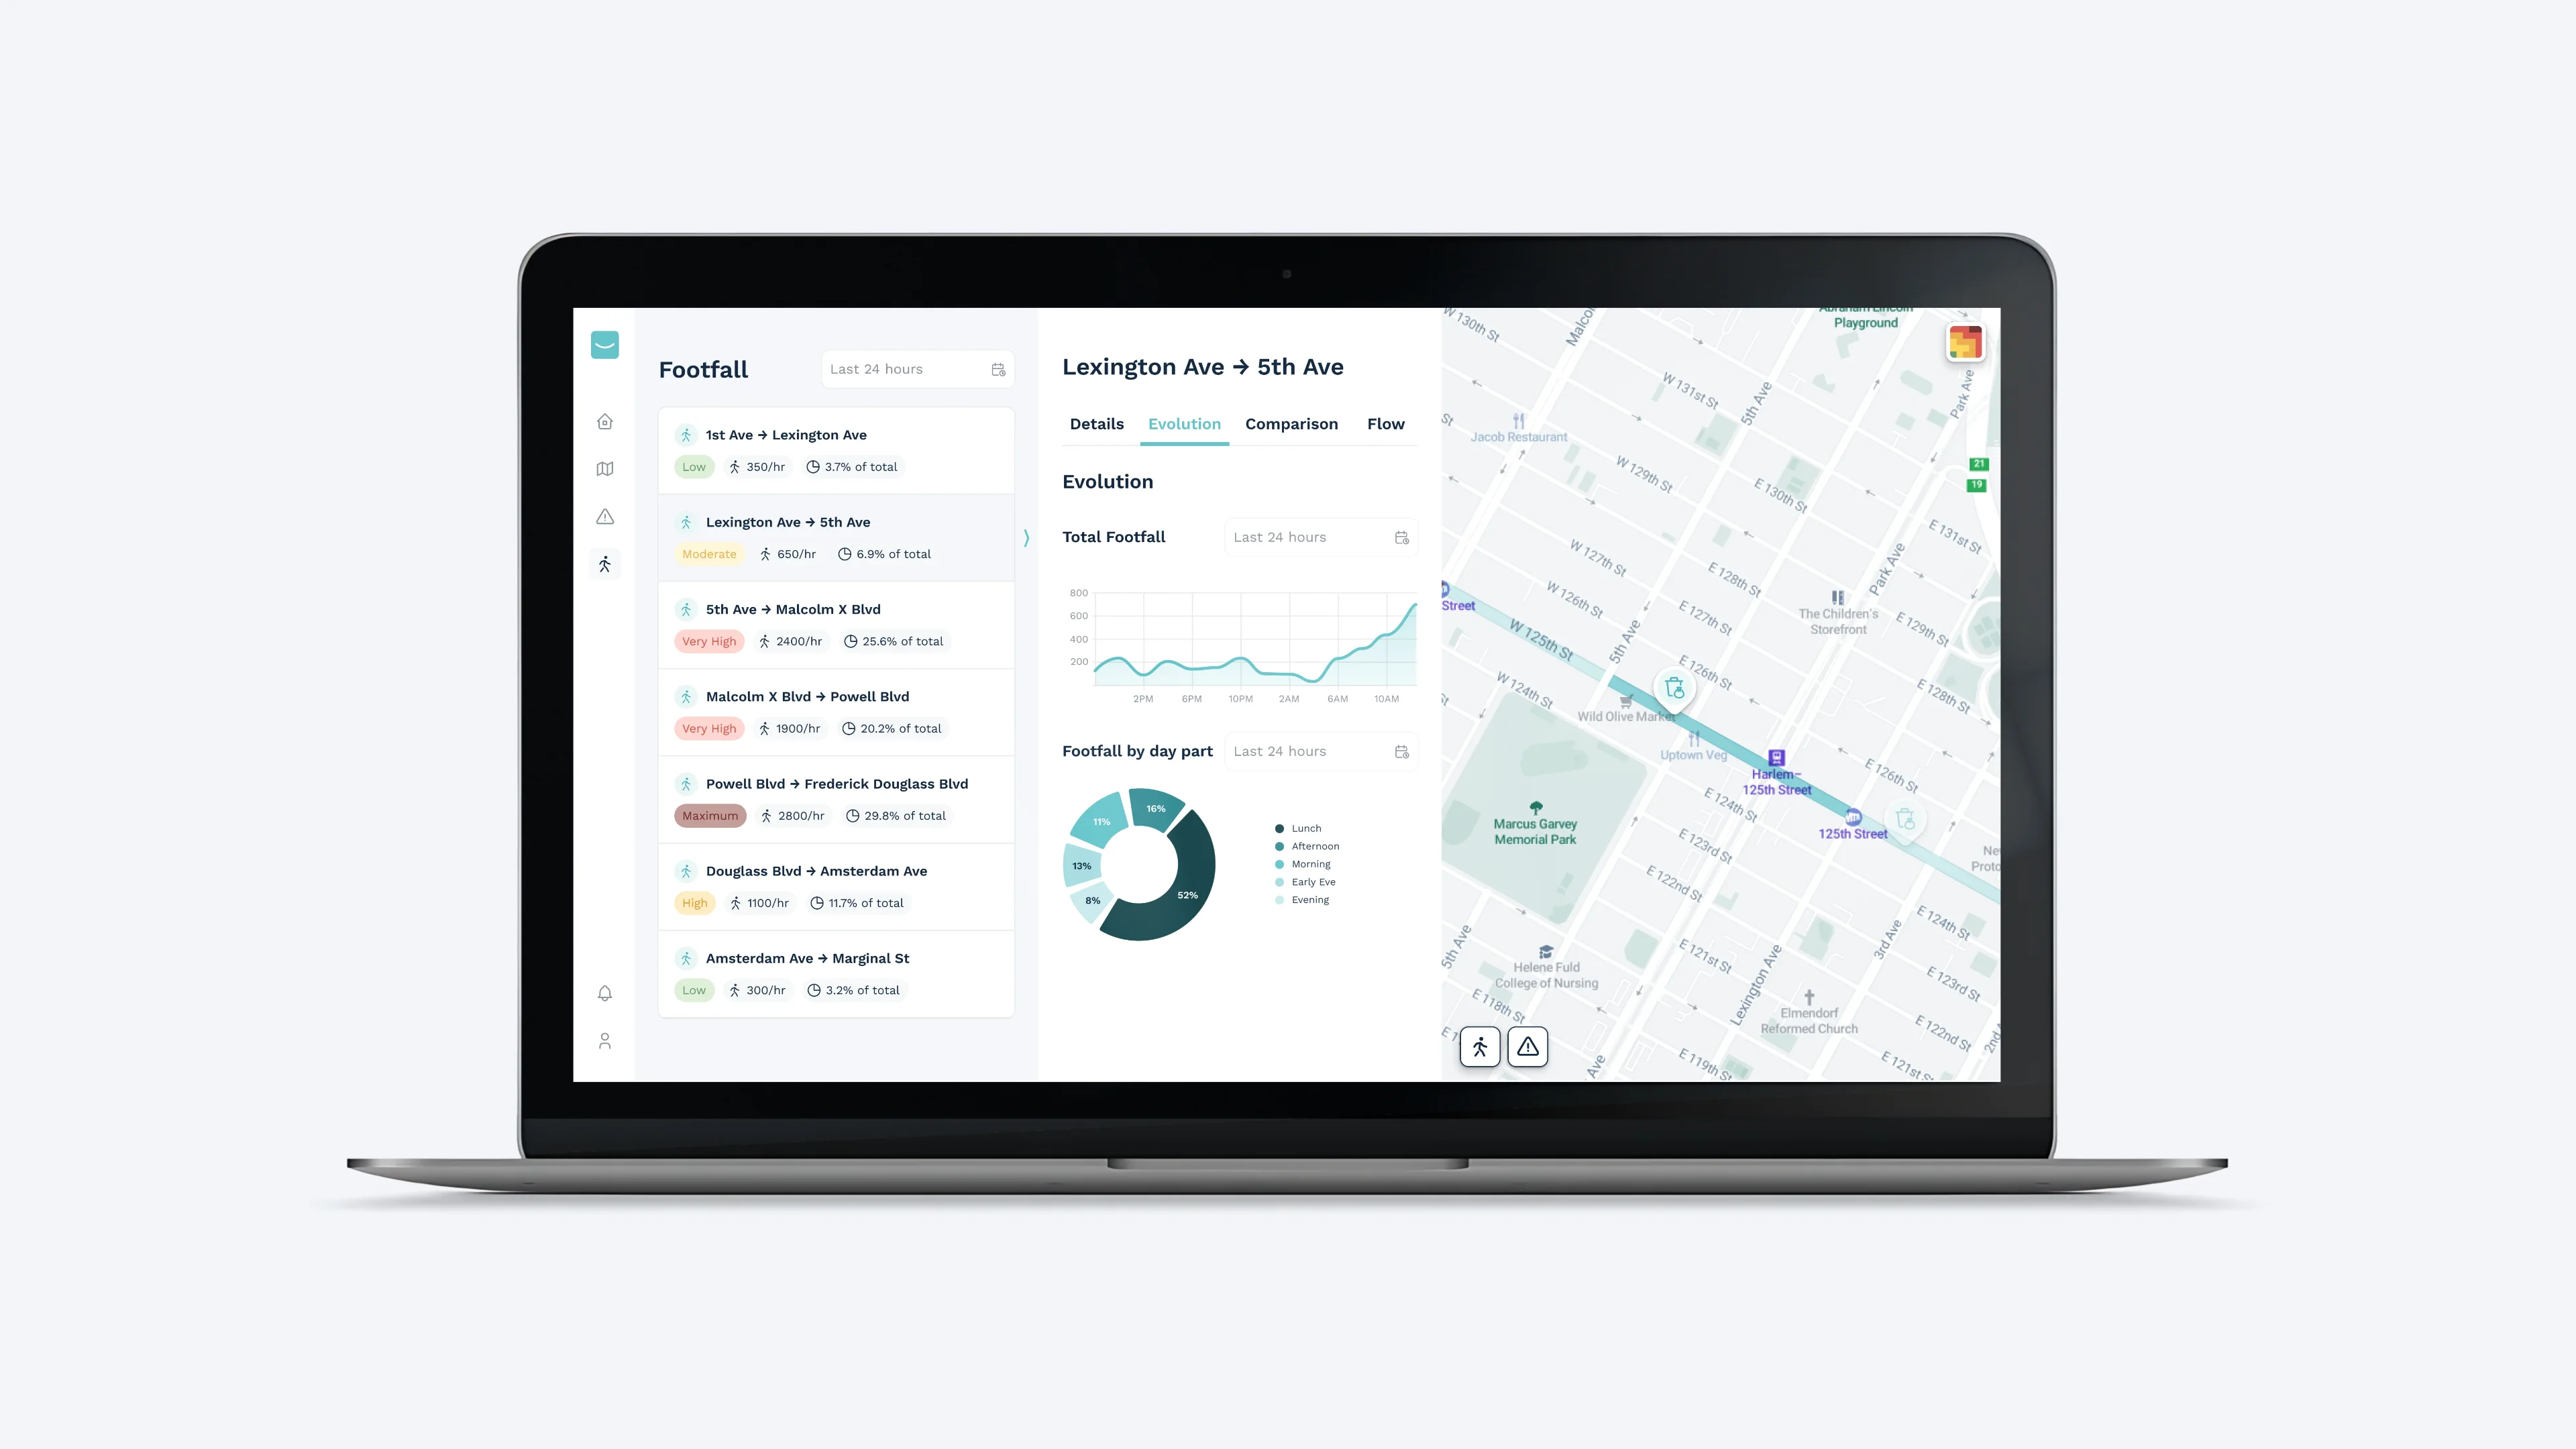
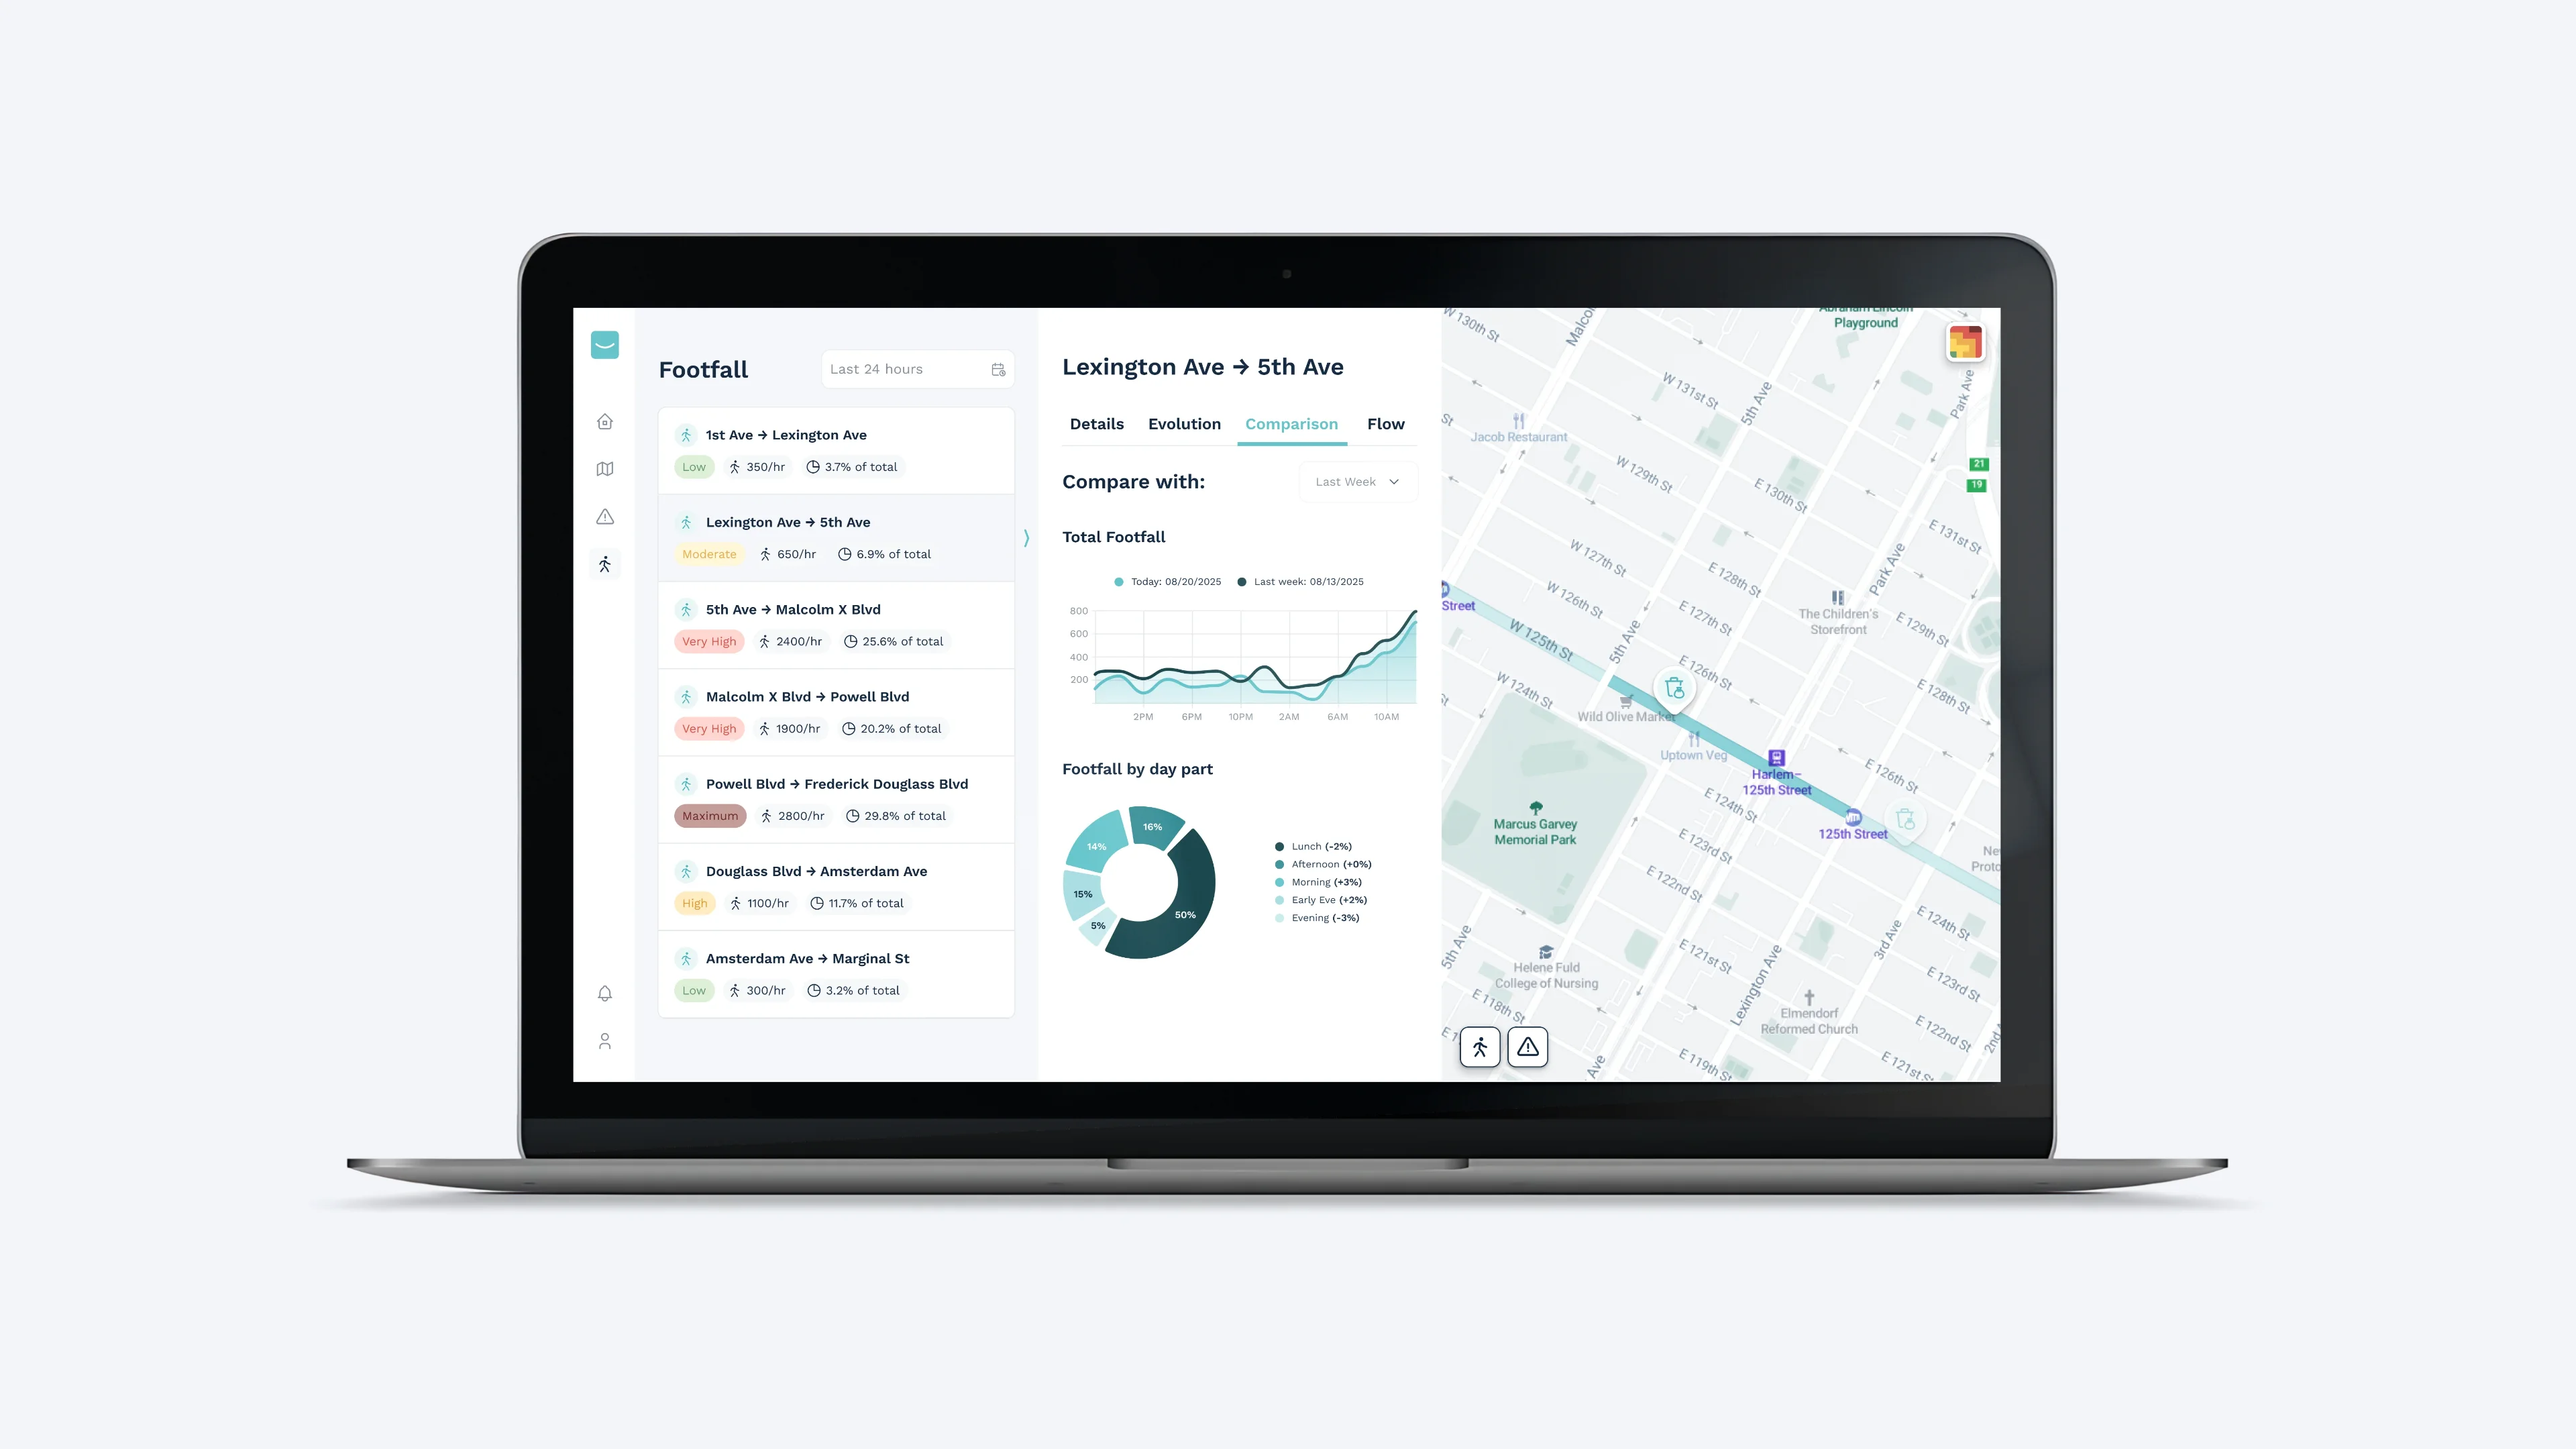
Integration of pedestrian footfall data to enable teams to monitor changes in pedestrian flows along 125th Street. The data is presented through charts and key indicators, allowing users to compare weekly and monthly trends. This visualisation provides a clear overview of pedestrian activity and helps put the territory’s operational data into context.
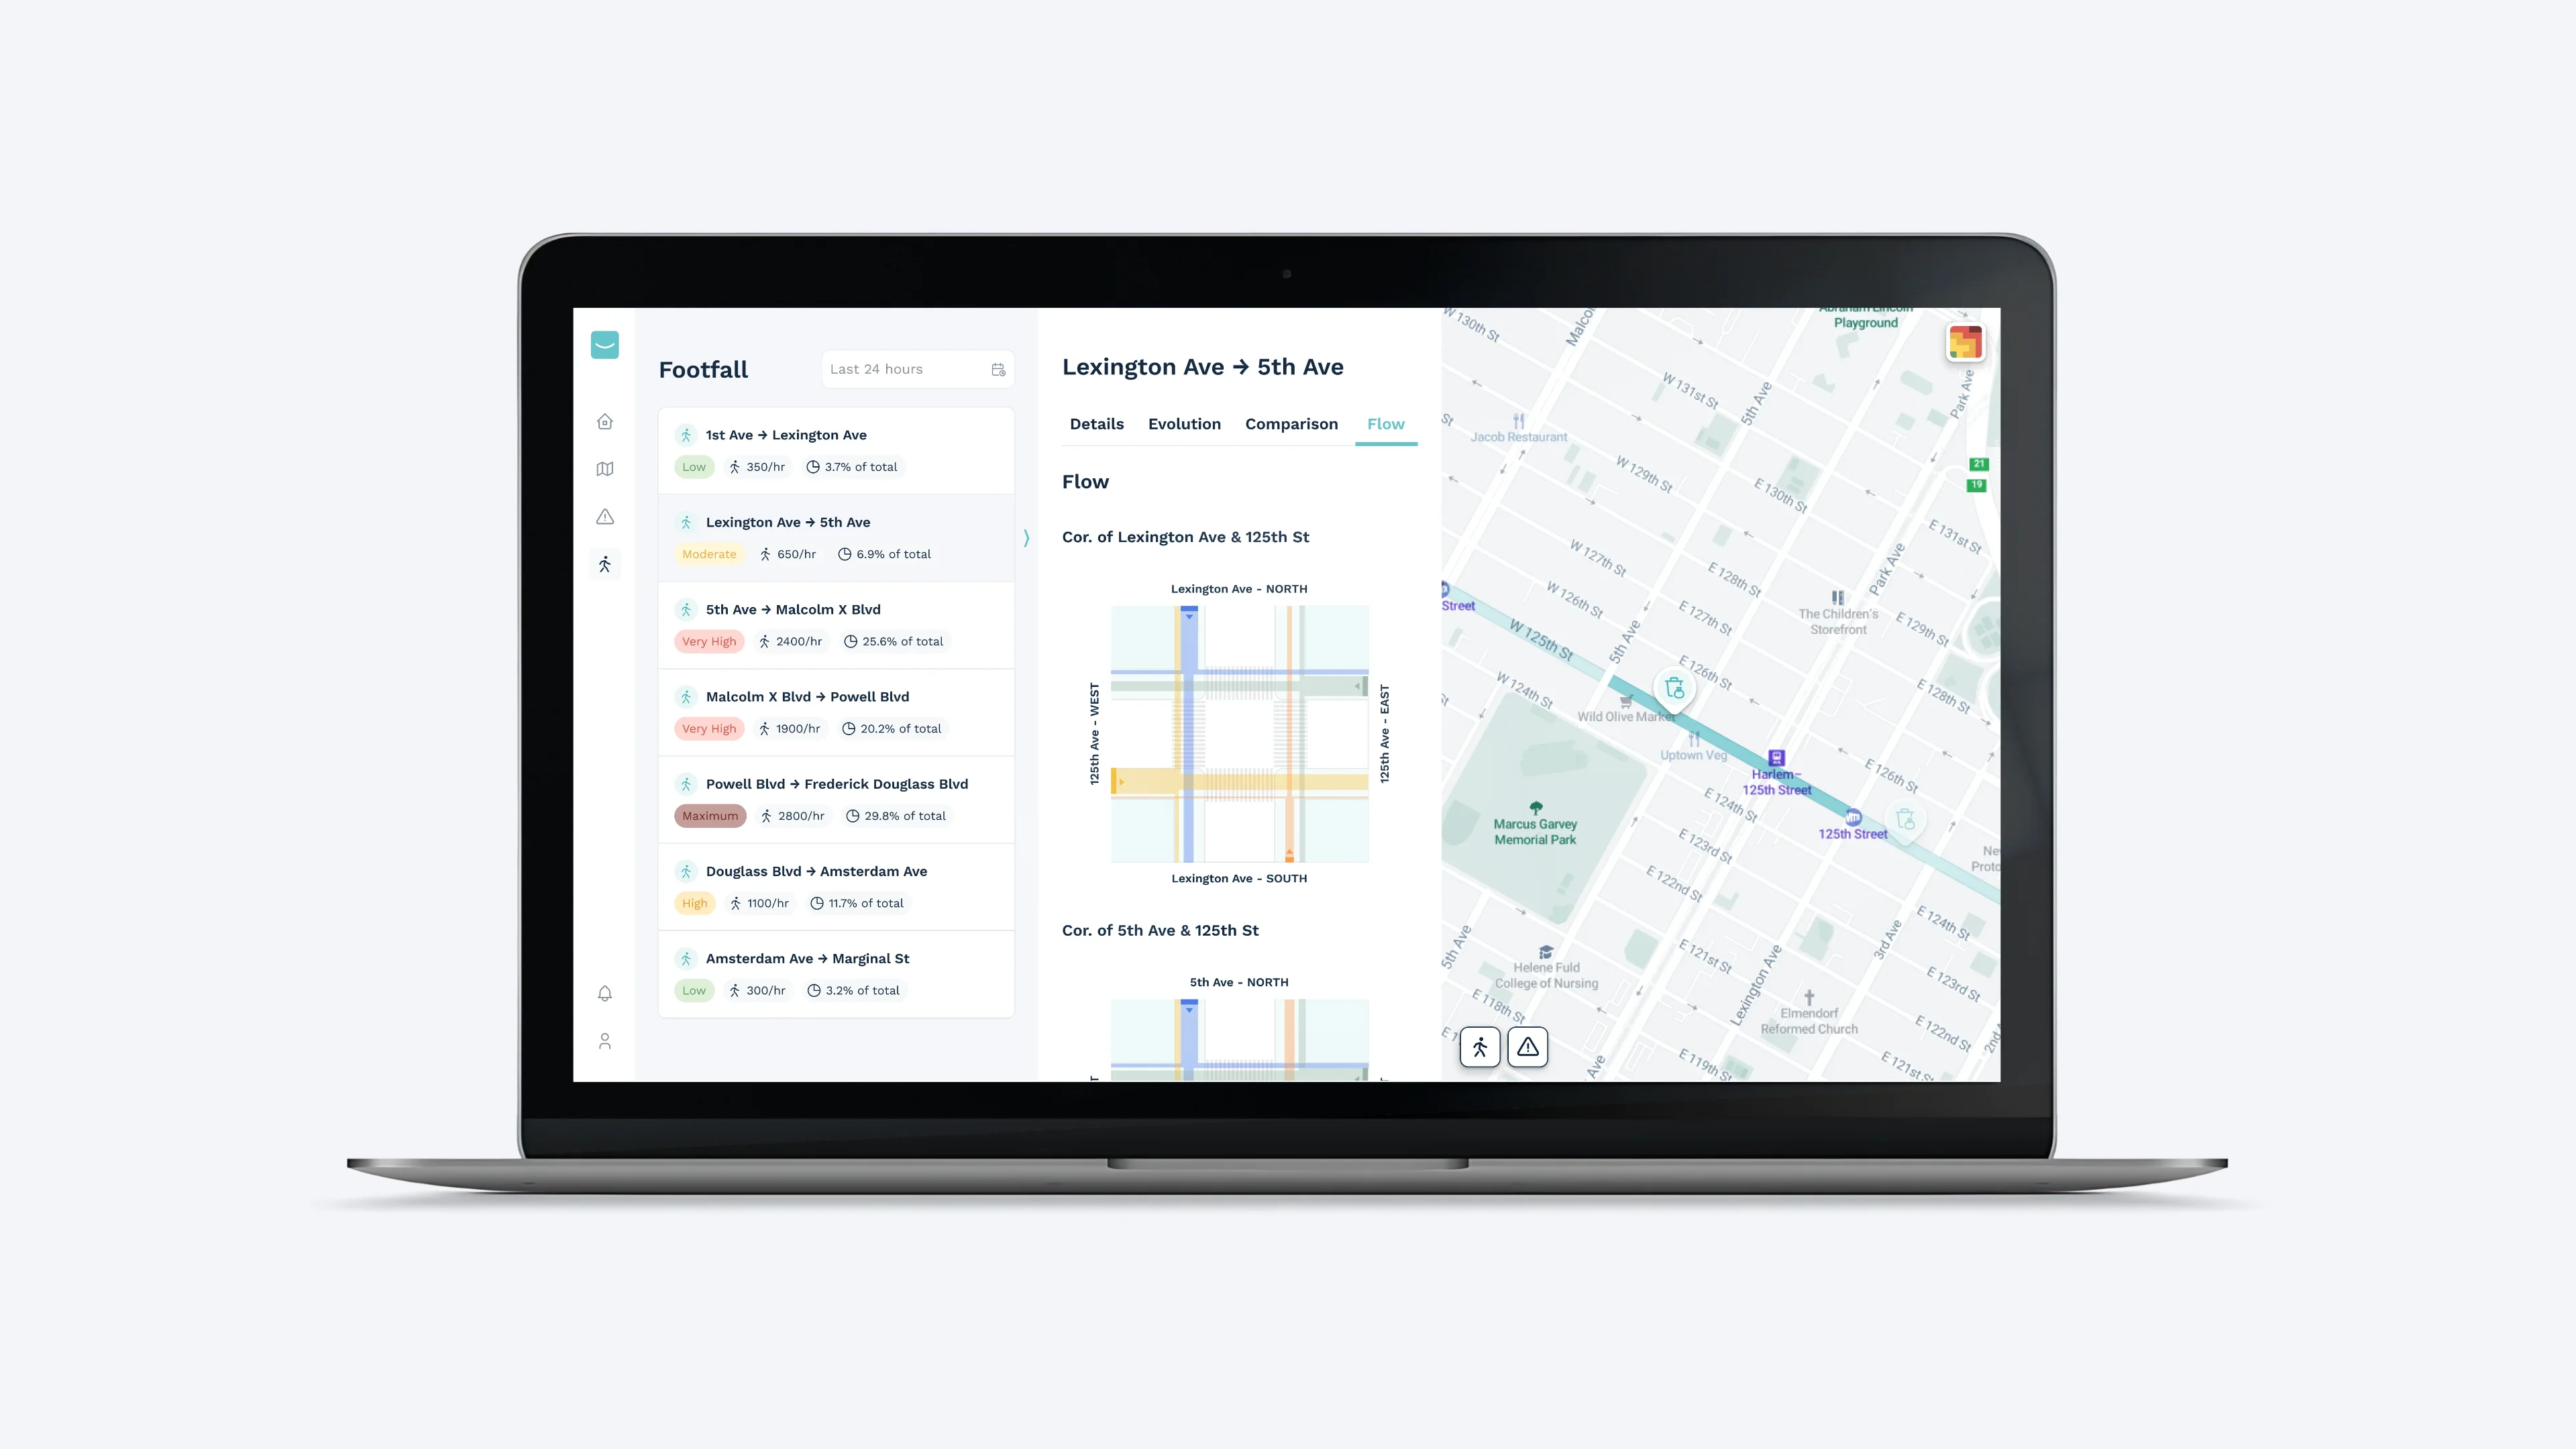
I designed a centralised experience enabling supervisors to monitor incidents, their resolution and pedestrian footfall data along 125th Street. The dashboard and interactive map provide greater visibility into operations and make it easier to analyse activity across the area.