Voyager

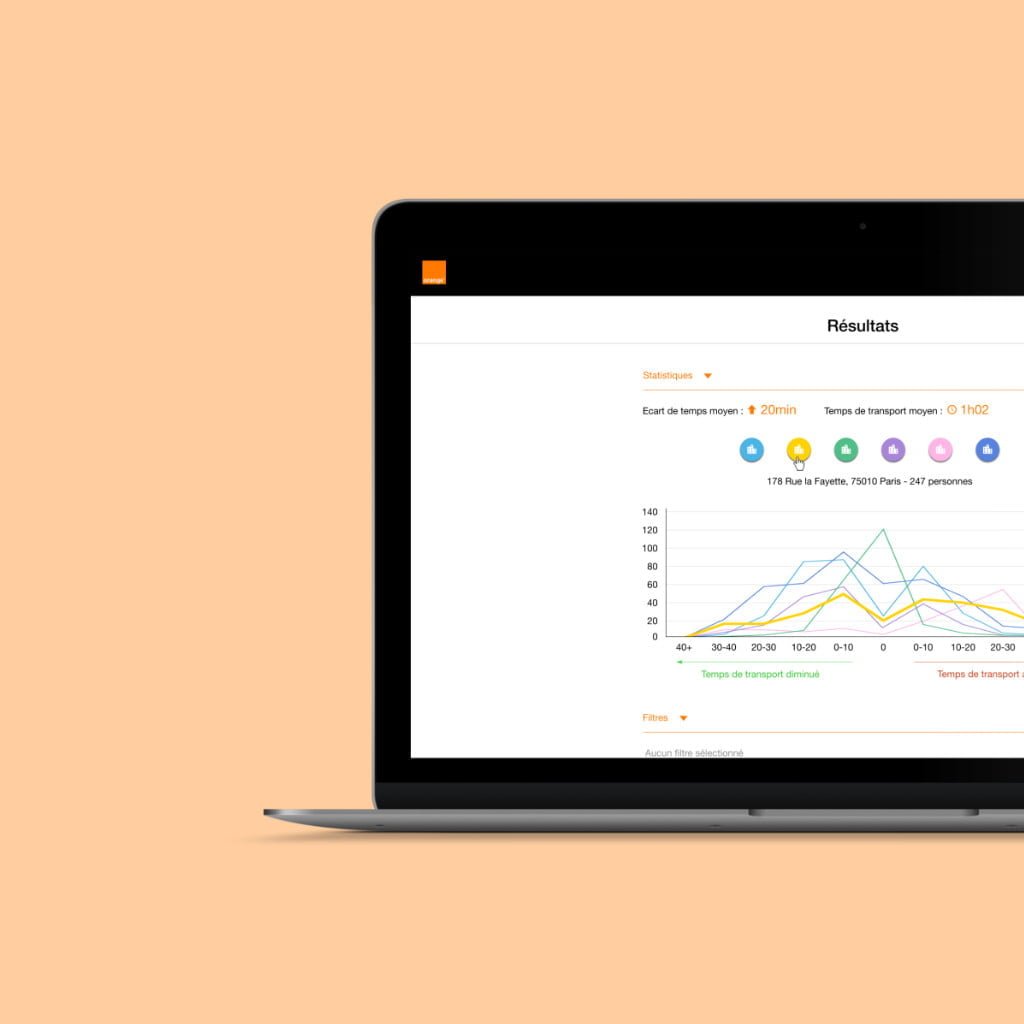
Orange Voyager is an R&D project for Orange Business Services. The application is based on Big Data and makes it possible to calculate the impact of transport times between home and the workplace, taking into account all modes of transport.
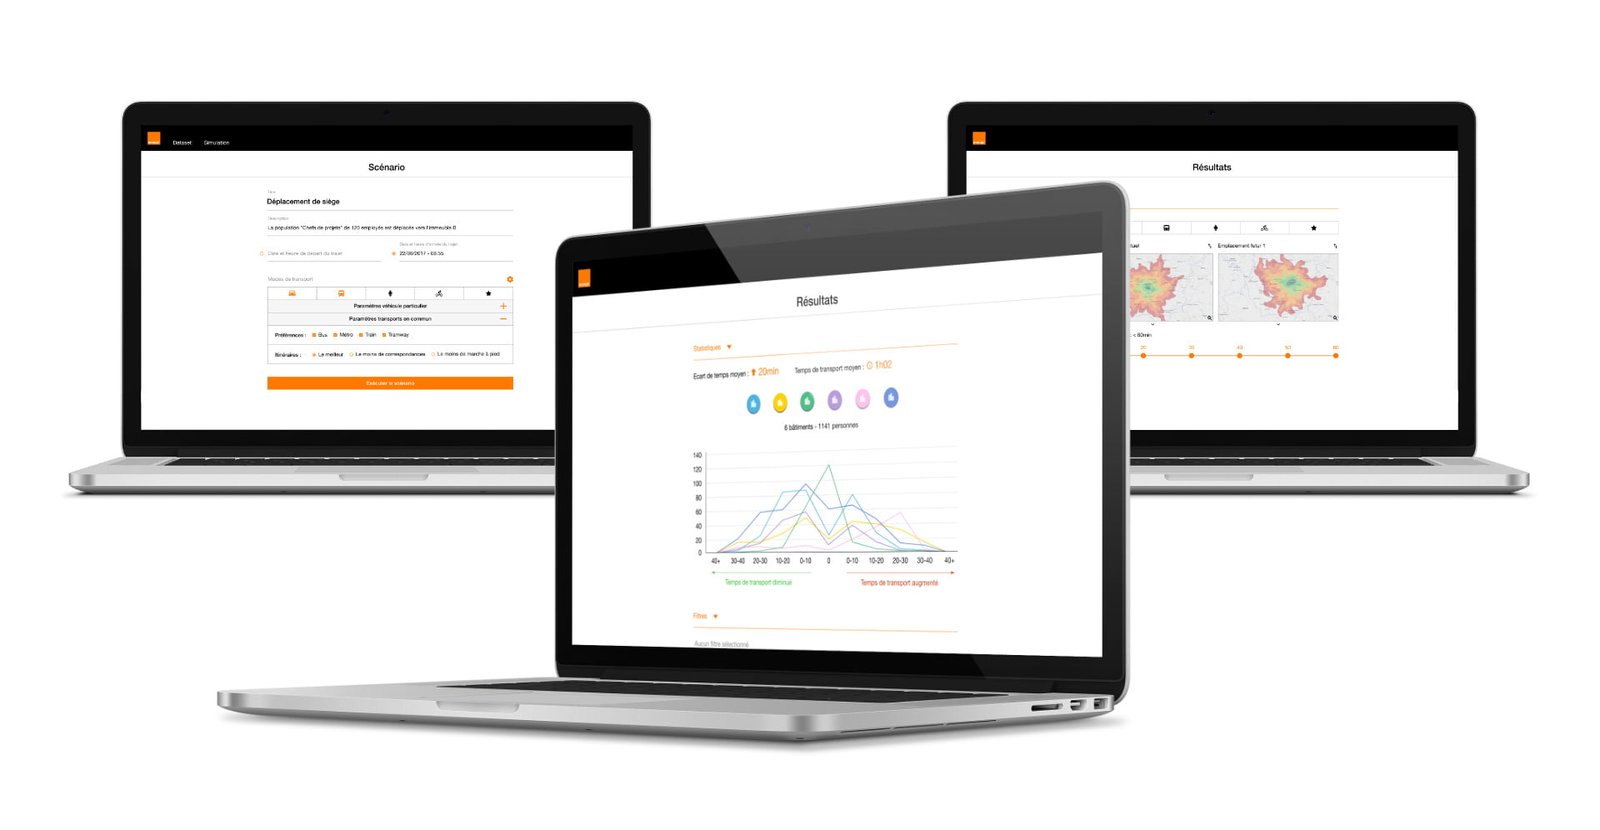
Summary
This transportation time calculator application offers advanced features, including the ability to determine the best choice of location for establishing or changing the address of a company's buildings. As a UX/UI designer, I had to design a complete user interface to make these complex analyzes accessible and visually attractive, while integrating Orange's official graphic charter.
Role
Design of the entire application
My main goal was to design the entire application, creating an intuitive and functional user interface that simplifies access to Big Data analytics.
Graphic visualization
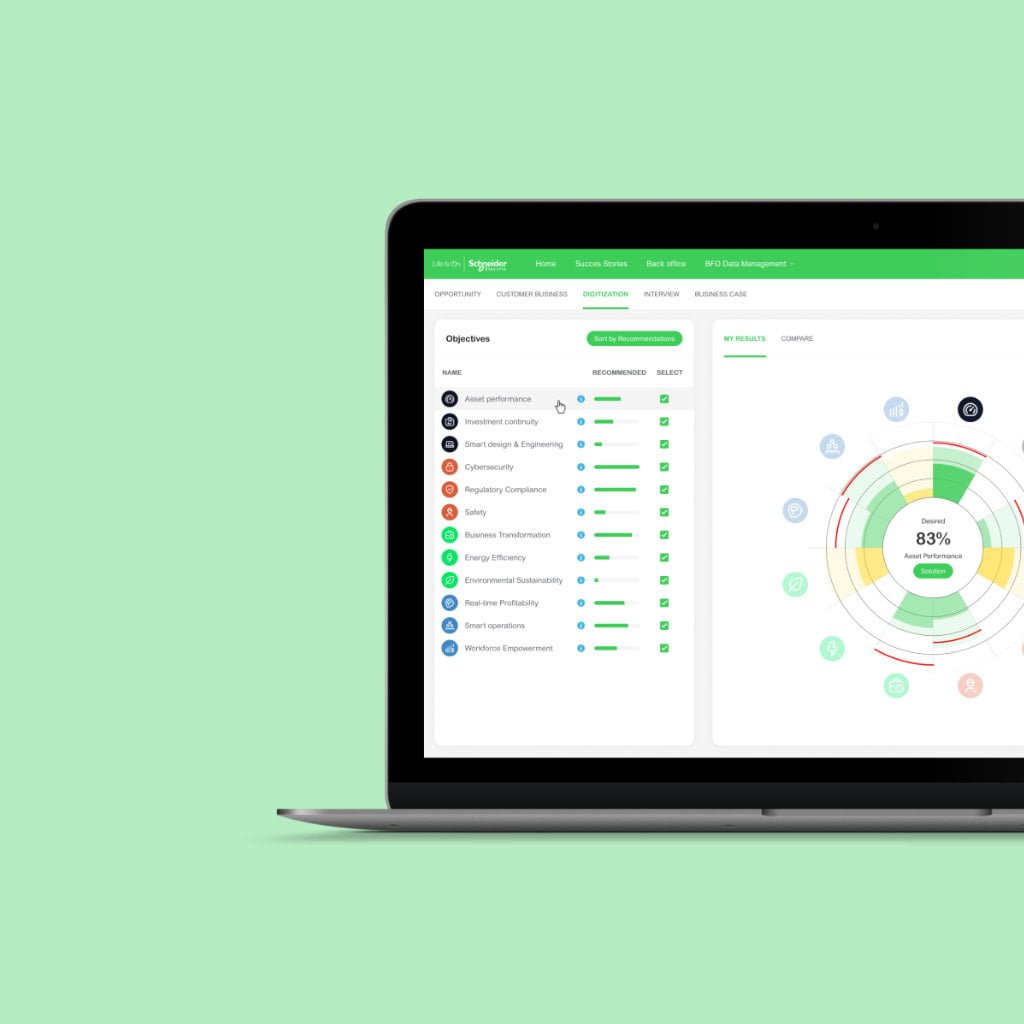
I developed graphical visualizations that allowed users to explore multiple axes of analysis to better understand transportation time data.
Animated mockups in SVG
I created animated mockups using SVG technology, thus offering more immersive mockups and making it easier to understand changes in graph data based on user choices.
Creation of adapted graphics based on the information
I developed graphics adapted to the different types of information sought, including curves, isochrones, radar charts, etc., to effectively represent complex data.
Application of the official Orange graphic charter
I integrated the official Orange graphic charter into the design of the entire application to guarantee visual consistency with the brand.
Conclusion
I created an intuitive user interface, with simplified graphic visualizations based on a large volume of data, while respecting the official Orange graphic charter. This application offers an innovative approach to decision making regarding the location of a business, using transportation data.

